- CFDs & Forex Trading | Regulated Online Trading
- About Us
- Trading
- Platforms
- Resources
- Partners
- Research
Search
×

Bollinger Bands are a versatile and widely-used volatility indicator developed by John Bollinger in the 1980s. They help traders understand price levels that are historically high or low relative to a central moving average. Here’s a detailed overview:

Bollinger Bands consist of three bands:
The middle band is a simple moving average that is typically set at 20 periods. A simple moving average is used due to the standard deviation formula it uses.
The outer bands (upper and lower) are normally set 2 standard deviations above and below the middle band.

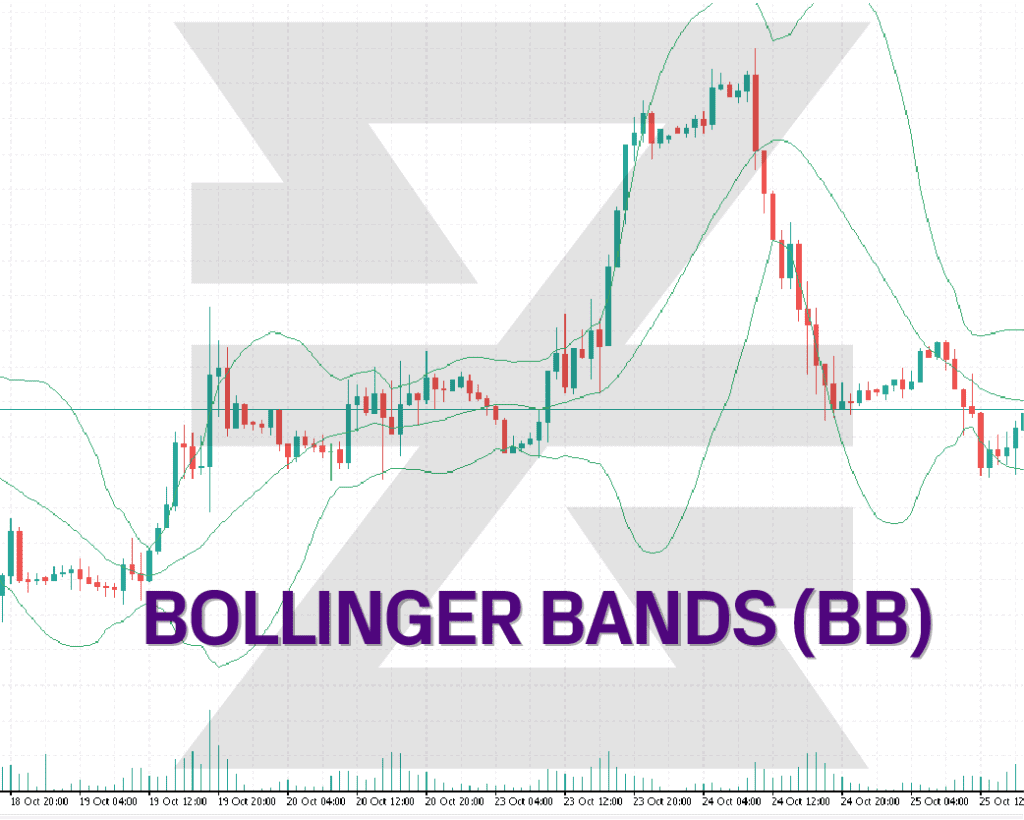
This setup essentially frames price movement in the context of standard deviations, revealing periods of high or low volatility.
When the price consistently touches the upper band, it can mean an overbought signal.
When the price consistently touches the lower band, it can mean an oversold signal.
• Middle Band = 20-day simple moving average (SMA)
• Upper Band = 20-day SMA + (20-day standard deviation of price x 2)
• Lower Band = 20-day SMA - (20-day standard deviation of price x 2)


• Volatility Indication:
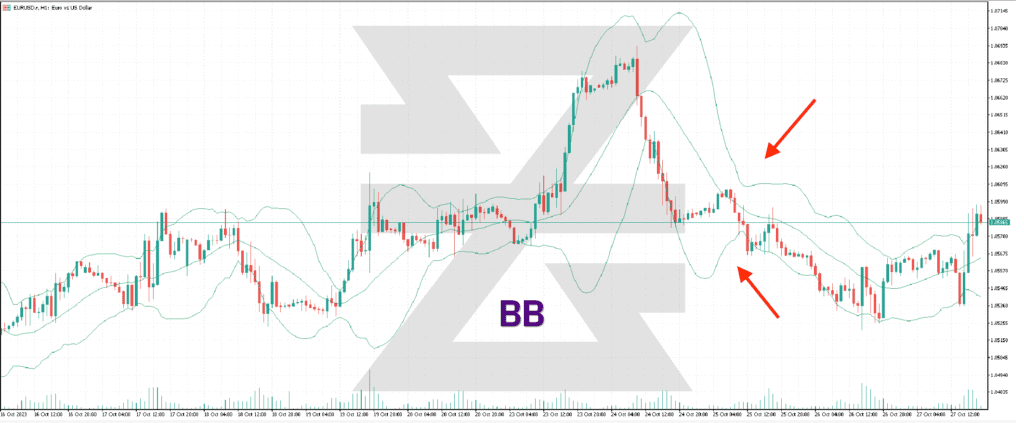
The width of the bands is a direct representation of volatility. A widening gap indicates increasing volatility, while a narrowing gap suggests decreasing volatility.
• Overbought/Oversold Conditions:
When prices touch or move above the upper band, the asset may be considered overbought. Conversely, when prices touch or move below the lower band, it might be viewed as oversold.
• The Squeeze:
A Bollinger Band squeeze denotes a period of low volatility and is seen as a potential indicator of future increased volatility and possible trading opportunities. It's identified when the bands come closest together.
• Breakouts:
Price moves that begin at one band and push towards the opposite band can be strong signals of trend continuation, especially if accompanied by other confirming signals.
• Not Exclusive to Trend Direction:
Bollinger Bands measure volatility but do not necessarily indicate future direction. Hence, a breakout could be either upward or downward.
• Be Mindful of False Breakouts:
Prices can move beyond the bands. However, these might be short-lived and not indicative of a continued trend, leading to potential false signals.
• Requires Context:
The effectiveness of Bollinger Bands can be enhanced when used in conjunction with other indicators, such as the Relative Strength Index (RSI) or the Moving Average Convergence Divergence (MACD).
John Bollinger, the creator of Bollinger Bands, initially used a 20-day moving average with bands set at 2 standard deviations. However, traders have since adapted and customized these settings based on individual strategies and the particular assets they trade.
Bollinger Bands are a valuable tool in discerning periods of high or low volatility, potential breakouts, and possible overbought or oversold conditions in Forex CFD trading. Their adaptive nature, reflecting changing market conditions, makes them a favorite among traders. However, as with all indicators, they are most effective when understood deeply and used in combination with other technical tools. Proper interpretation and risk management are paramount for utilizing Bollinger Bands successfully in a trading strategy.
Check out top trading indicators, including BB, and how they are used to make profit in this helpful video
→
Want to learn more? Discover more important concepts used in technical analysis for forex trading or view more trading indicators below
Start placing forex trades with a Baxia trading account
Looking for more?
Explore our Education Center
View our collection of free education resources dedicated to help you become a more informed and confident trader.
BAXIA GLOBAL LIMITED
Join the community
Risk Warning: Margin trading involves a high level of risk, and may not be suitable for all investors. You should carefully consider your objectives, financial situation, needs and level of experience before entering into any margined transactions with Baxia Markets, and seek independent advice if necessary. Forex and CFDs are highly leveraged products which mean both gains and losses are magnified. You should only trade in these products if you fully understand the risks involved and can afford losses without adversely affecting your lifestyle (including the risk of losing the entirety of your initial investment). You must assess and consider them carefully before making any decision about using our products or services.
Baxia Global Limited is a company registered in Seychelles with registration number: 8426970-1, and is regulated by the Financial Services Authority of Seychelles with License number: SD104.
Baxia Limited is a company registered in The Bahamas with registration number: 177330 B, and is licensed and regulated by The Securities Commission of The Bahamas (SCB), (SIA-F234).
The information on this website is general in nature and doesn’t take into account your personal objectives, financial circumstances, or needs. It is not targeted at the general public of any specific country and is not intended for distribution to residents in any jurisdiction where that distribution would be unlawful or contravene regulatory requirements. Baxia Markets does not offer its services to residents of certain jurisdictions such as USA, Cuba, Sudan/Republic of Sudan, Syria, Iran, Iraq, South Sudan, Venezuela, Libya, Belarus, Afghanistan, Myanmar, Russia, Crimea, Donetsk, Luhansk, Palestine, Yemen, Zimbabwe and North Korea.