- CFDs & Forex Trading | Regulated Online Trading
- About Us
- Trading
- Platforms
- Resources
- Partners
- Research
Search
×
Technical analysis is a method used to evaluate and predict the future price movements of financial instruments, such as stocks, commodities, and currencies, based on historical price and volume data. It operates on the fundamental principle that price patterns and trends tend to repeat themselves over time due to collective market psychology.
Let’s delve deeper into its core concepts and foundations:
The Core Premise:
At the heart of technical analysis is the belief that all relevant information – be it political, economic, or otherwise – is already factored into the price of an asset. Hence, by studying price patterns and other market indicators, analysts believe they can forecast future price changes.
Historical Data:
Technical analysis heavily relies on past data. This data is presented in the form of price charts, which provide a visual representation of an asset's price movement over a specified period. The most frequently used data points are the opening price, closing price, highest price, and lowest price for a given timeframe.
Market Psychology:
One of the reasons patterns tend to repeat is because of market psychology. Human emotions, such as fear and greed, play a significant role in trading decisions. These collective emotional responses can create recognizable and repetitive patterns on charts.
Trend Identification:
A foundational concept in technical analysis is the recognition of trends. Prices typically move in one of three directions: upwards (bullish trend), downwards (bearish trend), or sideways (neutral trend). Identifying these trends early can help traders position themselves advantageously.
Tools and Indicators:
Technical analysts use a range of tools and indicators to help decipher chart patterns and predict future price movements. These tools can range from simple moving averages, which show the average price over a set number of days, to more complex indicators like the Fibonacci retracement levels, which can help identify potential support and resistance levels.
Objective Analysis:
While it may seem that chart patterns are open to interpretation, technical analysis offers a more objective way to view the markets. By setting predefined criteria for trade entries, exits, and risk management, traders can make decisions based on data rather than emotions.
• Price Discounts Everything:
All information, whether public or private, is already reflected in the price.
• Price Moves in Trends:
Prices tend to move in trends (upward, downward, or sideways).
• History Tends to Repeat Itself:
Since market psychology remains relatively constant over time, price patterns often recur.

Learn more about basic principles applied in technical analysis for forex trading below
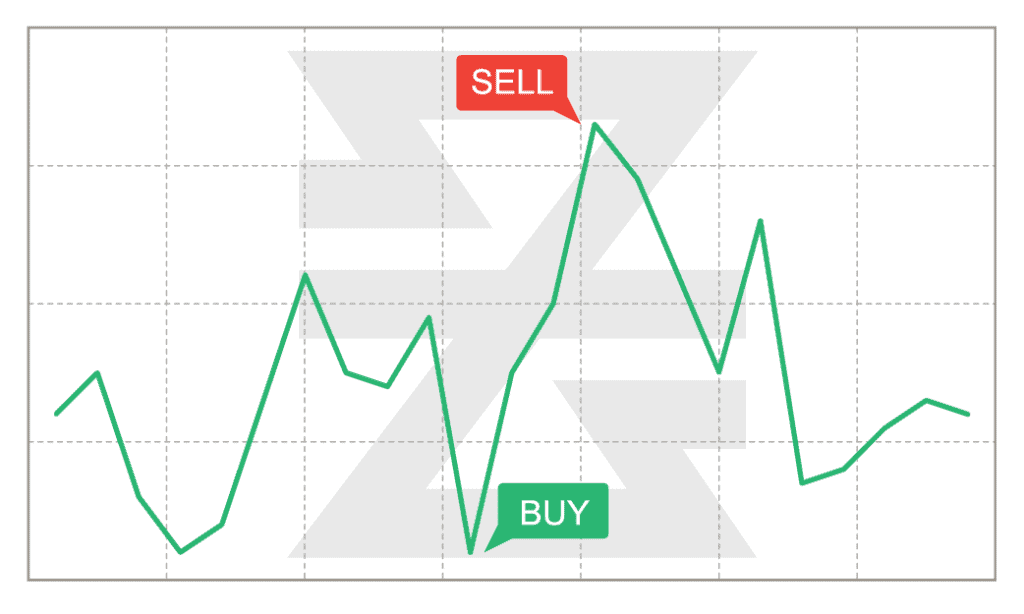
• Line Charts:
Displays the closing price for a specific time frame.
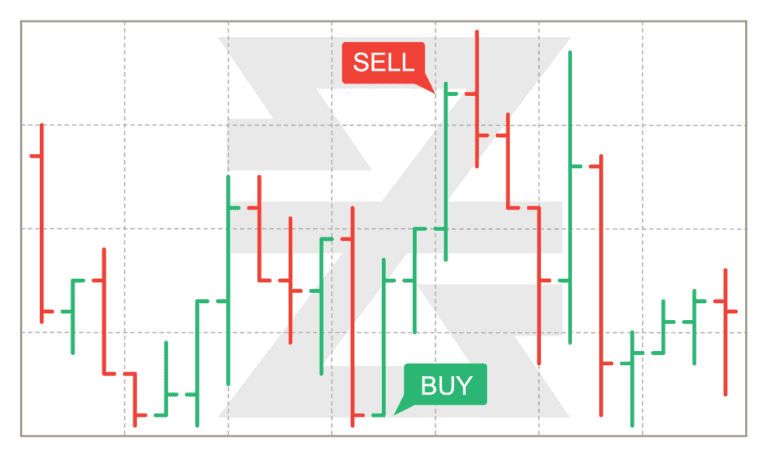
• Bar Charts:
Represents the opening, high, low, and closing prices for a given period.
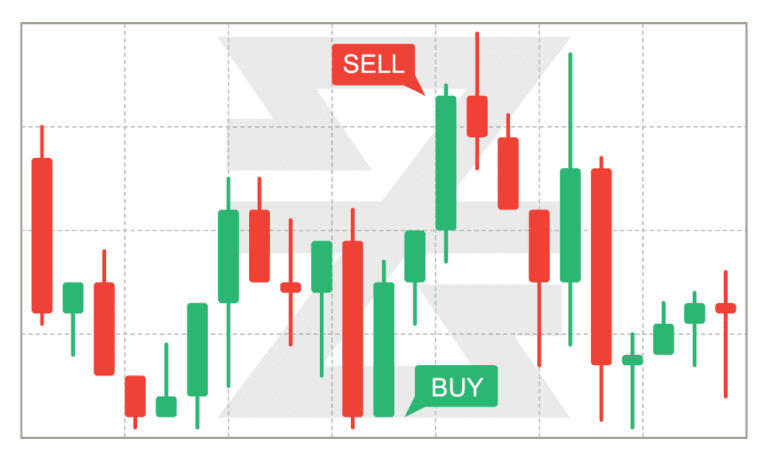
• Candlestick Charts:
Originating from Japan, these charts are similar to bar charts but highlight the relationship between opening and closing prices.

Learn more about types of charts used via technical analysis to identify profit opportunities in forex trading below
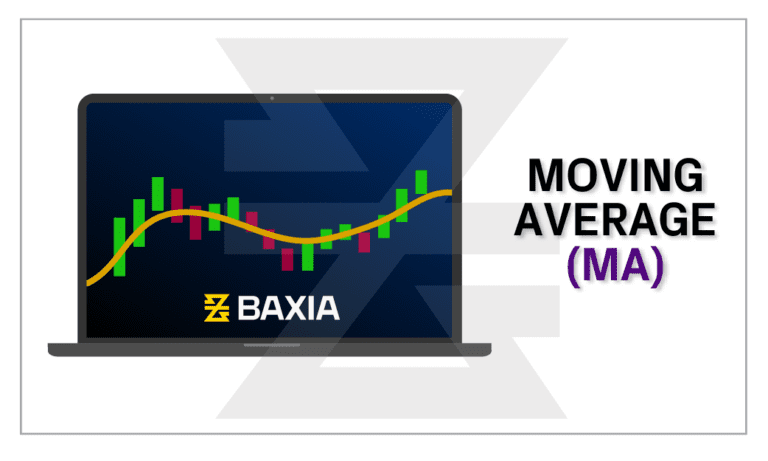
• Moving Averages (MA):
Average price over a specific period. Used to identify trends.
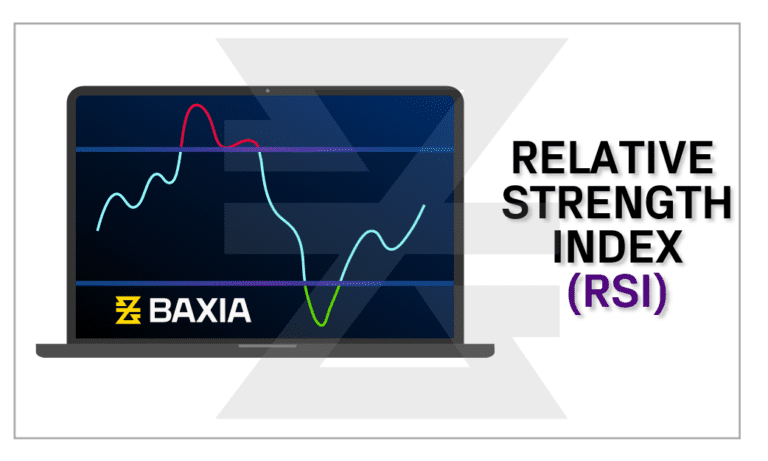
• Relative Strength Index (RSI):
Measures the speed and change of price movements. An asset is typically considered overbought or oversold when the RSI crosses certain thresholds.
• Moving Average Convergence Divergence (MACD):
Shows the relationship between two moving averages. Useful for spotting changes in the strength, direction, momentum, and duration of a trend.

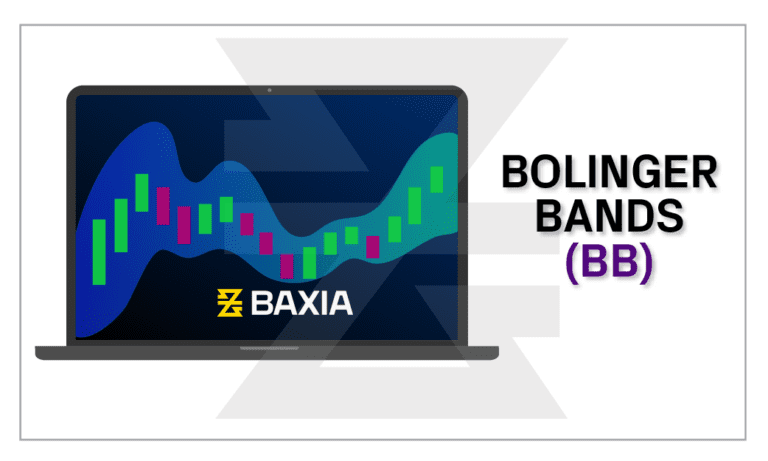
• Bollinger Bands:
Bands that encapsulate price movement. A band squeeze denotes a period of low volatility and is considered a potential indicator of future sharp price movements.
Learn more details about these top technical indicators used in technical analysis and how they work to help discover trading opportunities below
Check out top free trading indicators and how they are used to make profit in this helpful video
→
Patterns are formations created by the price movements of an asset on a chart. Recognizing these can provide insights into potential future price movements.
• Head and Shoulders:
Signifies a potential reversal of the current trend.

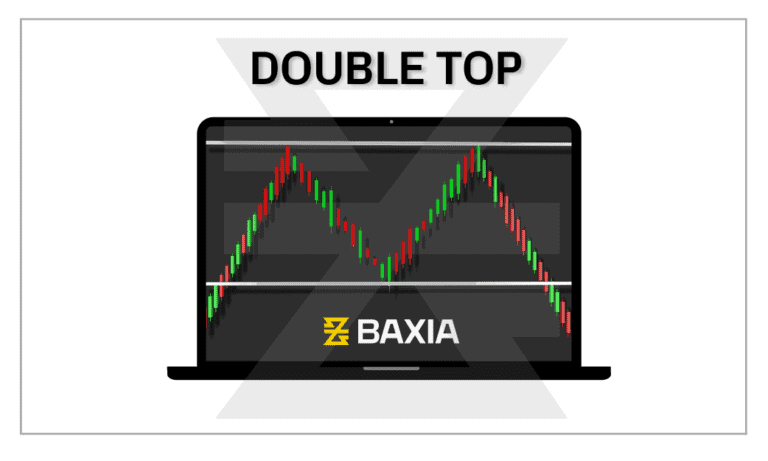
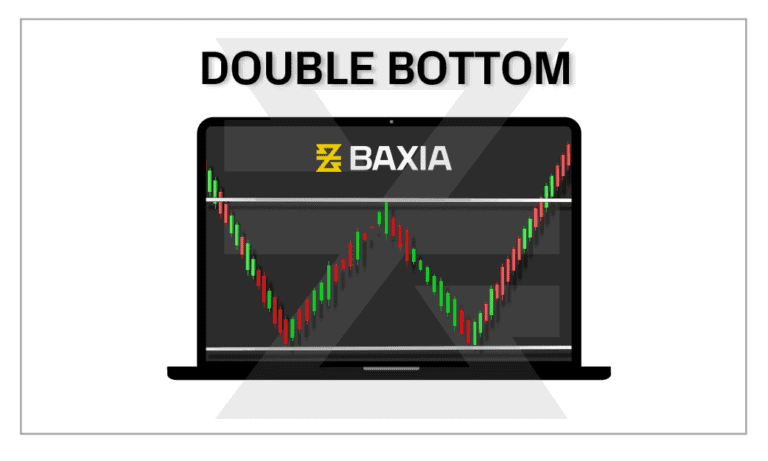
• Double Top and Double Bottom:
Indicate the potential end of a bullish or bearish trend, respectively.
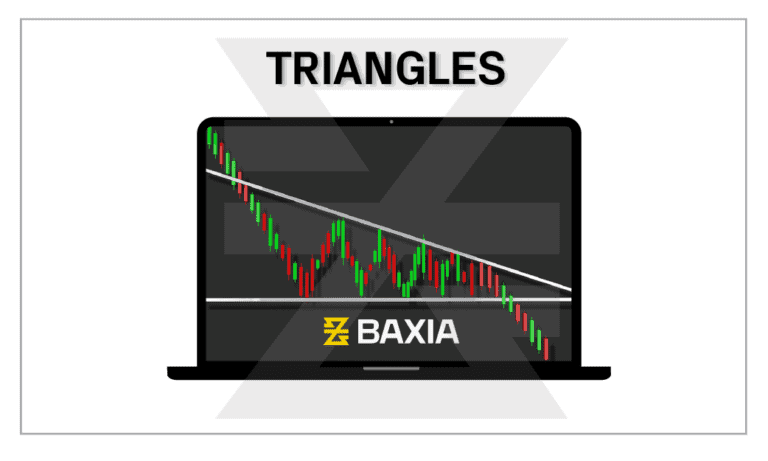
• Triangles:
Can be symmetrical, ascending, or descending, and often represent a continuation of the current trend.

Learn more about top chart patterns used in technical analysis for forex trading below
• Solid Objectives:
Provides clear signals based on historical data.
• Flexibility:
Applicable to short-term intraday charts and long-term charts alike.
• Reactivity:
Allows traders to respond quickly to market changes.

Learn more about advantages in technical analysis for forex trading below
• Not Foolproof:
Like all methods, it’s not 100% accurate.
• Self-fulfilling Prophecy:
If many traders act on the same signal, it can lead to the anticipated price movement, but this doesn’t always happen.
• Over-reliance:
Sole dependence without considering fundamentals can be risky.

Learn more about limitations used in technical analysis for forex trading below
While technical analysis is an invaluable tool in Forex CFD trading, it’s essential to use it in conjunction with other methods, understanding its strengths and limitations. As with all trading strategies, continuous learning and practice are key to mastering the art of technical analysis.
Start placing forex trades with a Baxia trading account
Looking for more?
Explore our Education Center
View our collection of free education resources dedicated to help you become a more informed and confident trader.
BAXIA LIMITED
BAXIA GLOBAL LIMITED
Join the community
Risk Warning: Margin trading involves a high level of risk, and may not be suitable for all investors. You should carefully consider your objectives, financial situation, needs and level of experience before entering into any margined transactions with Baxia Markets, and seek independent advice if necessary. Forex and CFDs are highly leveraged products which mean both gains and losses are magnified. You should only trade in these products if you fully understand the risks involved and can afford losses without adversely affecting your lifestyle (including the risk of losing the entirety of your initial investment). You must assess and consider them carefully before making any decision about using our products or services.
Baxia Global Limited is a company registered in Seychelles with registration number: 8426970-1, and is regulated by the Financial Services Authority of Seychelles with License number: SD104.
Baxia Limited is a company registered in The Bahamas with registration number: 177330 B, and is licensed and regulated by The Securities Commission of The Bahamas (SCB), (SIA-F234).
The information on this website is general in nature and doesn’t take into account your personal objectives, financial circumstances, or needs. It is not targeted at the general public of any specific country and is not intended for distribution to residents in any jurisdiction where that distribution would be unlawful or contravene regulatory requirements. Baxia Markets does not offer its services to residents of certain jurisdictions such as USA, Cuba, Sudan/Republic of Sudan, Syria, Iran, Iraq, South Sudan, Venezuela, Libya, Belarus, Afghanistan, Myanmar, Russia, Crimea, Donetsk, Luhansk, Palestine, Yemen, Zimbabwe and North Korea.