- CFDs & Forex Trading | Regulated Online Trading
- About Us
- Trading
- Platforms
- Resources
- Partners
- Research
Search
×
Learn about different types of chart patterns to improve your trading skills by identifying investment opportunities.
We discuss 10 basic chart patterns to help identify the basic reversal and continuation chart patterns to assist you with more trading opportunities you may not know about below.
SHARE THIS ARTICLE:
Chart Patterns are one of the most popular ways to identify a trading opportunity, they allow you to examine current movements to forecast future market movements.
There are multiple trading strategies you can use, regardless of your trading style, you can select from hundreds of technical indicators built in your trading platform, you can also add indicators from the market tab, but there is one more element that you will need to be successful and this is your ability to identify chart patterns.
Transitions between rising and falling trends are often signaled by price patterns, a price pattern is a recognizable configuration of price movement that is identified using a series of trendlines and/or curves.
In order to become a more successful trader you will need to easily spot these patterns on a graph chart; this will help you identify trading opportunities and also it will help you confirm or reject some of the signals you obtain from other technical indicators.
Trading chart patterns are valuable tools for identifying potential trading opportunities. Chart patterns, such as flags, provide visual representations of market behavior and can signal possible trends or reversals.
By recognizing chart trading patterns, traders can make informed decisions based on historical price movements and anticipate future price action. Flags, a specific type of chart pattern, indicate temporary pauses in a trend before a resumption. Understanding and interpreting these patterns empower traders to pinpoint entry and exit points, enhancing their trading strategies.
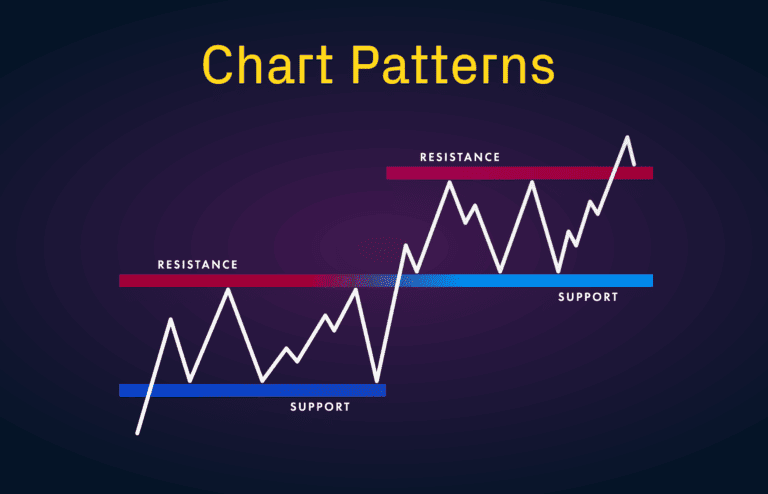
Chart Patterns can be Continuation Patterns or Reversal Patterns; when a price pattern signals a change in trend direction, it is known as a reversal pattern; a continuation pattern occurs when the trend continues in its existing direction following a brief pause.
We are going to go through the 10 most used chart patterns and break them down for you so you can start identifying them on a graph chart.
You can identify a head and shoulders pattern by looking for a large peak with smaller peaks to its sides, this will help you predict a bullish to bearish reversal.
They all must have the same support level for it to be effective, this is known as the neckline, once the third peak falls back to this support level it is likely that the price will break that support level and the price will enter a downtrend.
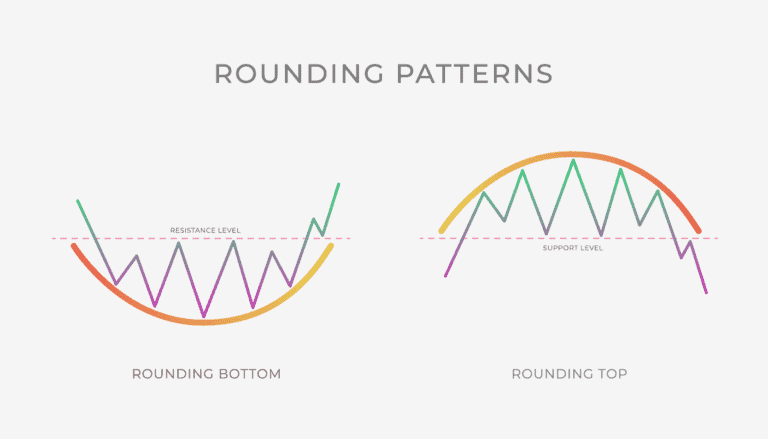
Also known as a cup or saucer bottom; this pattern helps you identify a reversal uptrend, it looks like a U shape on the graph and its often used by traders to buy in the dip at the middle of the U or once it has already formed as it is likely that the price will go bullish, this usually happens when the downtrend is becoming an uptrend.
During an uptrend an asset’s price may retrace slightly before rising again. It could often be confused with a cup and handle pattern but on Rounding Bottom there is no handle.
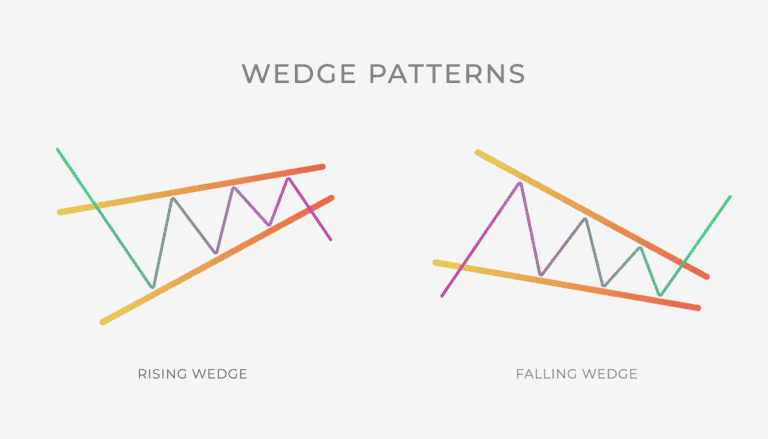
A wedge can be identified by finding two trend lines moving in the same direction but with different slopes, there are two types of wedge, falling and rising. You can identify a wedge when the price movements are shrinking towards the end of the lines.
The rising wedge occurs when the support line is steeper than the resistance line, you can usually see this on an uptrend, after the lines get closer together a downtrend breakout can be expected.
The falling wedge will have a steeper resistance level than the support line, this indicates that the price is expected to breakout on an uptrend.
This is a reversal bearish pattern, it’s relatively easy to identify as it consists of two peaks about the same size and at a very similar price level. It follows a long uptrend and it forms an M shape, once the second peak starts to breakout the support level set by the middle of the M the price is expected to go down.
It can be mistaken with the head and shoulder, but the main difference is that there are only two twin peaks instead of three with a head and shoulders pattern.
A double bottom indicates that the price has made two unsuccessful attempts to break the support level and usually indicates that an uptrend is on its way, this pattern forms a W where the two bottom peaks are and the breakout attempts found a strong support level, once the price breaks through the resistance after forming a W the price is expected to reverse the downtrend.
This pattern normally appears during an upward trend and indicates a continuation of the rising price, you can identify it by drawing an horizontal line on the highs that became a resistance level and an ascending line along the support levels.
Usually we can expect a breakout point where the lines get together, make sure that the peaks are almost identical so it allows you to draw a flat horizontal line on the chart.
This pattern signifies a bearish continuation of the price on a downtrend; the resistance level is now a descending line while the support becomes the horizontal line, once they convey, you can expect the price to break through that support level and continue moving downwards.
A rectangle shape develops from two lines that follow the support and resistance these lines need to be parallel but also need to have a slope, which should be moving in the opposite direction of the original price movement, this pattern will allow you to identify a breakout, the trend will usually continue in the direction of the breakout.
They often form after an aggressive upwards or downwards movement followed by price consolidation where the range starts to narrow, usually price will move in the same direction as the previous trend, they are often confused with symmetrical triangles, the main difference is that the trend lines move in different directions but they are not symmetrical.
Two trend lines are drawn almost symmetrically on the support and resistance levels, the unique characteristic is that the upper line is descending and the lower line is ascending, the breakout can happen in either direction; however, it often follows the previous general trend of the asset.
It’s very similar to the Rounded Bottom; however the key difference is that it forms a “handle” that slopes slightly downwards which after is expected to complete a breakout on the resistance level and continue the uptrend.
Technical analysis chart patterns are essential tools for traders seeking to analyze and predict market movements. These chart trading patterns, such as flags, triangles, and double tops or bottoms, provide valuable insights into market trends and potential price reversals. By studying these chart patterns, traders can identify support and resistance levels, spot entry and exit points, and make informed trading decisions. Flags, a specific chart pattern, signify temporary pauses in a trend before a resumption, allowing traders to anticipate favorable trading opportunities.
We hope that the information provided in this article was interesting to you and mostly that you can use this information to improve your trading skills. We strive to present this information in a way that is easy for you to digest. If you enjoyed this article make sure to visit our resources page to find more information that can help you become a better trader and test those strategies on a trading account
Sign up for a trading account to receive more articles and start identifying different candlestick patterns that will help you improve your trading skills.
Start placing trades with a Baxia Markets trading account
View our collection of free education resources dedicated to help you become a more informed and confident trader.
BAXIA LIMITED
BAXIA GLOBAL LIMITED
Join the community
Risk Warning: Margin trading involves a high level of risk, and may not be suitable for all investors. You should carefully consider your objectives, financial situation, needs and level of experience before entering into any margined transactions with Baxia Markets, and seek independent advice if necessary. Forex and CFDs are highly leveraged products which mean both gains and losses are magnified. You should only trade in these products if you fully understand the risks involved and can afford losses without adversely affecting your lifestyle (including the risk of losing the entirety of your initial investment). You must assess and consider them carefully before making any decision about using our products or services.
Baxia Global Limited is a company registered in Seychelles with registration number: 8426970-1, and is regulated by the Financial Services Authority of Seychelles with License number: SD104.
Baxia Limited is a company registered in The Bahamas with registration number: 177330 B, and is licensed and regulated by The Securities Commission of The Bahamas (SCB), (SIA-F234).
The information on this website is general in nature and doesn’t take into account your personal objectives, financial circumstances, or needs. It is not targeted at the general public of any specific country and is not intended for distribution to residents in any jurisdiction where that distribution would be unlawful or contravene regulatory requirements. Baxia Markets does not offer its services to residents of certain jurisdictions such as USA, Cuba, Sudan/Republic of Sudan, Syria, Iran, Iraq, South Sudan, Venezuela, Libya, Belarus, Afghanistan, Myanmar, Russia, Crimea, Donetsk, Luhansk, Palestine, Yemen, Zimbabwe and North Korea.