- CFDs & Forex Trading | Regulated Online Trading
- About Us
- Trading
- Platforms
- Resources
- Partners
- Research
Search
×
The Double Top and Double Bottom patterns are classic chart formations in technical analysis that signal trend reversals. The Double Top indicates a bearish reversal following an uptrend, while the Double Bottom points to a bullish reversal after a downtrend.

Both patterns consist of two distinct peaks (or troughs) at approximately the same price level, resembling the letter “M” for Double Top and “W” for Double Bottom.
Double Top (M-shaped pattern)
• First Peak:
Created after a prolonged uptrend and serves as an initial resistance point.
• Trough:
The decline from the first peak stops at a support level, from which the price then rises.
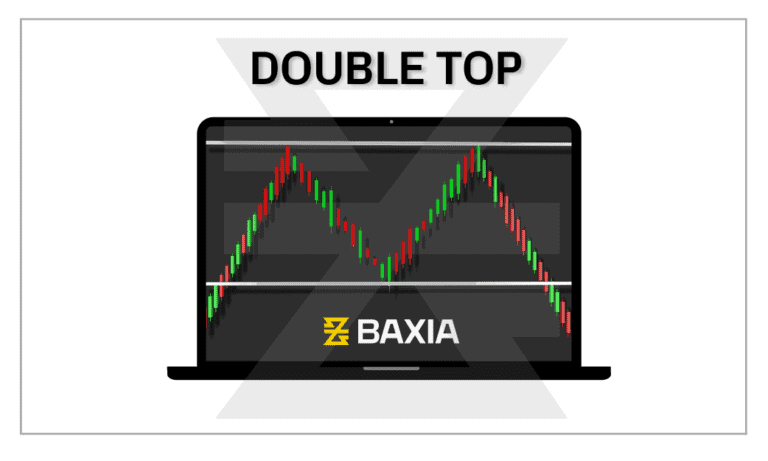
• Second Peak:
It forms when the price rallies again but can't surpass the first peak's height, indicating weakening momentum.
• Neckline or Support Break:
After forming the second peak, if the price breaks below the trough’s level, a trend reversal is confirmed.
Double Bottom (W-shaped pattern)
Constituted by a horizontal support line and a downward sloping trendline.
• First Trough:
Occurs after a significant downtrend and acts as a key support point.
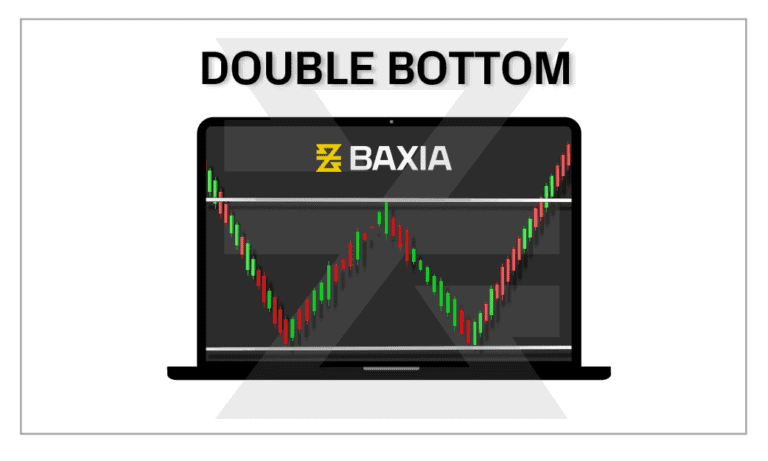
• Peak:
The rally from the first trough reaches a resistance level, then price retraces.
• Second Trough:
Price drops again but doesn't go below the first trough's depth, showing reduced selling momentum.
• Neckline or Resistance Break:
A trend reversal is confirmed if the price, after forming the second trough, breaks above the peak's level.
• How to Find Entry Points:
For Double Top, traders might consider entering a short position after a confirmed break below the neckline. For Double Bottom, a break above the neckline can signal an opportunity to go long.
• How to Find Price Targets:
The vertical distance between the peaks and the neckline can be projected from the neckline breakout point to estimate the potential price target.
• When Should Volume Confirmation Occur?
For a Double Top, volume should decrease as the second peak forms and increase during the neckline break. For Double Bottom, decreased volume at the second trough and increased volume at the resistance break is ideal.
• Neckline Slope
While horizontal necklines are common, they can also slope. The direction and steepness of the slope can influence the pattern's reliability.
• What Is the Duration for Double Top & Double Bottom Patterns?
These patterns are more reliable when they take longer to form—typically several weeks to months.
• Retests:
After the neckline is broken, prices might retest it before continuing in the new trend direction. This retest can serve as an additional confirmation.
• Be Cautious of False Breakouts:
Prices might break the neckline briefly and then reverse, creating a potential false signal. Confirmatory indicators or waiting for a clear breakout can mitigate this risk.
Both the Double Top and Double Bottom patterns have been a staple in technical analysis for decades. Their recognition came with the early work of analysts who observed these recurring formations, leading to the patterns being used as reliable signals of trend reversals.
The Double Top and Double Bottom patterns are foundational in the world of Forex CFD trading. Their simplicity and efficacy, combined with other tools and proper risk management, make them invaluable for traders aiming to capitalize on market reversals. Understanding the nuances of these patterns and applying them judiciously can significantly aid in making informed trading decisions.
Want to learn more? Discover more important concepts used in technical analysis for forex trading below
Start placing forex trades with a Baxia trading account
Looking for more?
Explore our Education Center
View our collection of free education resources dedicated to help you become a more informed and confident trader.
BAXIA LIMITED
BAXIA GLOBAL LIMITED
Join the community
Risk Warning: Margin trading involves a high level of risk, and may not be suitable for all investors. You should carefully consider your objectives, financial situation, needs and level of experience before entering into any margined transactions with Baxia Markets, and seek independent advice if necessary. Forex and CFDs are highly leveraged products which mean both gains and losses are magnified. You should only trade in these products if you fully understand the risks involved and can afford losses without adversely affecting your lifestyle (including the risk of losing the entirety of your initial investment). You must assess and consider them carefully before making any decision about using our products or services.
Baxia Global Limited is a company registered in Seychelles with registration number: 8426970-1, and is regulated by the Financial Services Authority of Seychelles with License number: SD104.
Baxia Limited is a company registered in The Bahamas with registration number: 177330 B, and is licensed and regulated by The Securities Commission of The Bahamas (SCB), (SIA-F234).
The information on this website is general in nature and doesn’t take into account your personal objectives, financial circumstances, or needs. It is not targeted at the general public of any specific country and is not intended for distribution to residents in any jurisdiction where that distribution would be unlawful or contravene regulatory requirements. Baxia Markets does not offer its services to residents of certain jurisdictions such as USA, Cuba, Sudan/Republic of Sudan, Syria, Iran, Iraq, South Sudan, Venezuela, Libya, Belarus, Afghanistan, Myanmar, Russia, Crimea, Donetsk, Luhansk, Palestine, Yemen, Zimbabwe and North Korea.