- CFDs & Forex Trading | Regulated Online Trading
- About Us
- Trading
- Platforms
- Resources
- Partners
- Research
Search
×
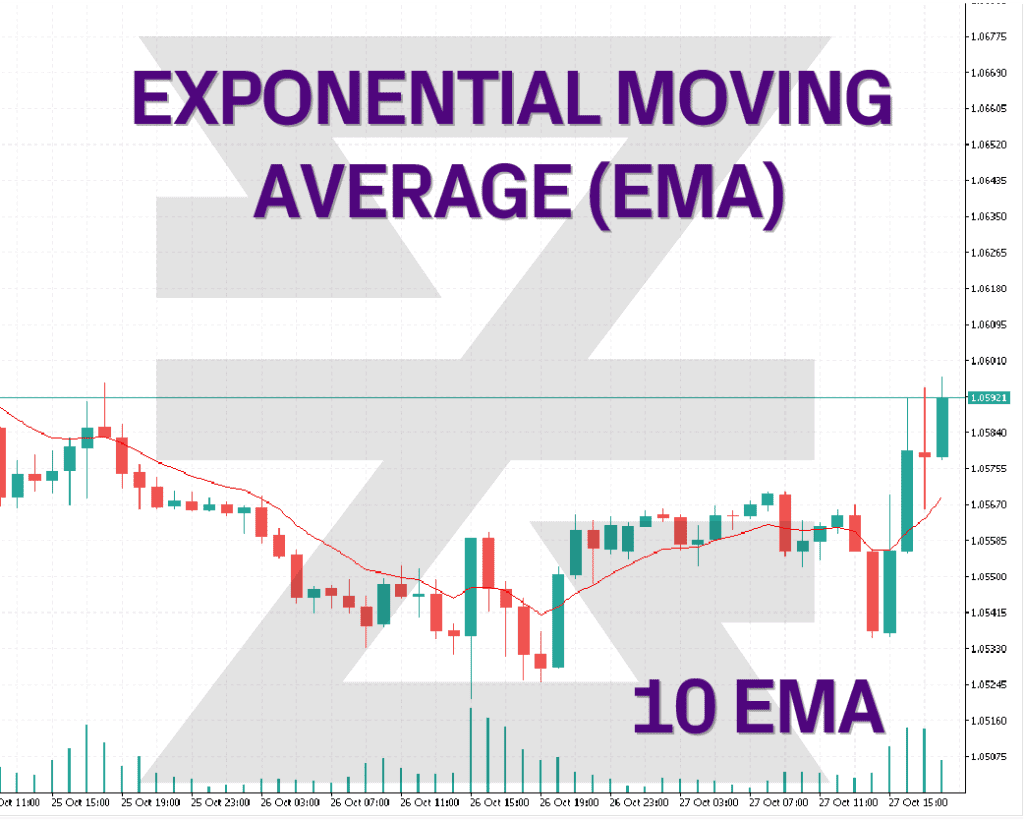
The Exponential Moving Average (EMA) is a more advanced form of moving average that places greater weight on recent price data. Let’s unpack its characteristics, calculations, and nuances.
QUICK LINK TO CONTENT

The Exponential Moving Average (EMA) provides a more immediate reflection of price changes than the Simple Moving Average. By prioritizing recent prices, it’s more responsive to current market conditions.
While the SMA evenly distributes weight, the EMA gives progressively more weight to recent prices. The calculation involves both the current price and the previous period’s EMA.
EMAt=(Ct×α)+(EMAt−1×(1−α))
Where:
To initialize the EMA calculation, you can start with an SMA for the first value, then use the above formula to compute subsequent EMA values.
It’s worth noting that the more weight given to the recent prices, the faster the EMA will adjust to price changes. This weighting is accomplished by the smoothing factor α.

• Trend Identification:
Similar to the SMA, the direction of the EMA line can help identify prevailing market trends. A rising EMA indicates an uptrend, and a falling EMA suggests a downtrend.
• Price Crossovers:
When the price crosses above the EMA, it might signal a bullish trend, while a drop below could indicate potential bearishness.
• EMA Crossovers:
Using two EMAs (short-term and long-term) is a popular strategy. A short-term EMA crossing above a long-term one is a bullish signal, while the opposite is considered bearish.
• Support and Resistance:
The EMA can act as a dynamic support or resistance level. Price might find difficulty crossing the EMA line, reflecting potential market sentiment.
• Reactivity vs Noise:
While the EMA is more reactive to price changes, it's also susceptible to market "noise". This means it might react to short-lived price fluctuations, which aren't indicative of a genuine trend.
• Still a Lagging Indicator:
Despite its reactivity, the EMA remains a lagging indicator because it's based on past price data, albeit more recent.
• Optimal Period Selection:
Choosing the best period for the EMA is crucial. A shorter EMA will be more reactive but might give false signals, while a longer EMA may lag too much.
Given its sensitivity to recent prices, the EMA will often change direction before the SMA, potentially offering earlier entry or exit signals. However, this reactivity can also lead to false signals, especially during volatile periods.
The Exponential Moving Average is a valuable tool, especially when timely responses to market changes are desired. While it offers advantages over the SMA, especially in rapidly changing markets, traders should be wary of its potential to generate false signals. As with any tool in Forex CFD trading, it’s best used in conjunction with other indicators and robust risk management strategies.
Want to learn more? Discover more important concepts used in technical analysis for forex trading or view more trading indicators below
Start placing forex trades with a Baxia trading account
Looking for more?
Explore our Education Center
View our collection of free education resources dedicated to help you become a more informed and confident trader.
BAXIA LIMITED
BAXIA GLOBAL LIMITED
Join the community
Risk Warning: Margin trading involves a high level of risk, and may not be suitable for all investors. You should carefully consider your objectives, financial situation, needs and level of experience before entering into any margined transactions with Baxia Markets, and seek independent advice if necessary. Forex and CFDs are highly leveraged products which mean both gains and losses are magnified. You should only trade in these products if you fully understand the risks involved and can afford losses without adversely affecting your lifestyle (including the risk of losing the entirety of your initial investment). You must assess and consider them carefully before making any decision about using our products or services.
Baxia Global Limited is a company registered in Seychelles with registration number: 8426970-1, and is regulated by the Financial Services Authority of Seychelles with License number: SD104.
Baxia Limited is a company registered in The Bahamas with registration number: 177330 B, and is licensed and regulated by The Securities Commission of The Bahamas (SCB), (SIA-F234).
The information on this website is general in nature and doesn’t take into account your personal objectives, financial circumstances, or needs. It is not targeted at the general public of any specific country and is not intended for distribution to residents in any jurisdiction where that distribution would be unlawful or contravene regulatory requirements. Baxia Markets does not offer its services to residents of certain jurisdictions such as USA, Cuba, Sudan/Republic of Sudan, Syria, Iran, Iraq, South Sudan, Venezuela, Libya, Belarus, Afghanistan, Myanmar, Russia, Crimea, Donetsk, Luhansk, Palestine, Yemen, Zimbabwe and North Korea.