- CFDs & Forex Trading | Regulated Online Trading
- About Us
- Trading
- Platforms
- Resources
- Partners
- Research
Search
×

Fibonacci Retracement is a popular tool that draws upon the mathematical properties of the Fibonacci sequence to identify potential levels of support and resistance in price charts. Derived from the works of the 13th-century mathematician Leonardo Fibonacci, it seeks to pinpoint where a price may potentially reverse after a move either up or down. Here’s a comprehensive look:
QUICK LINK TO CONTENT

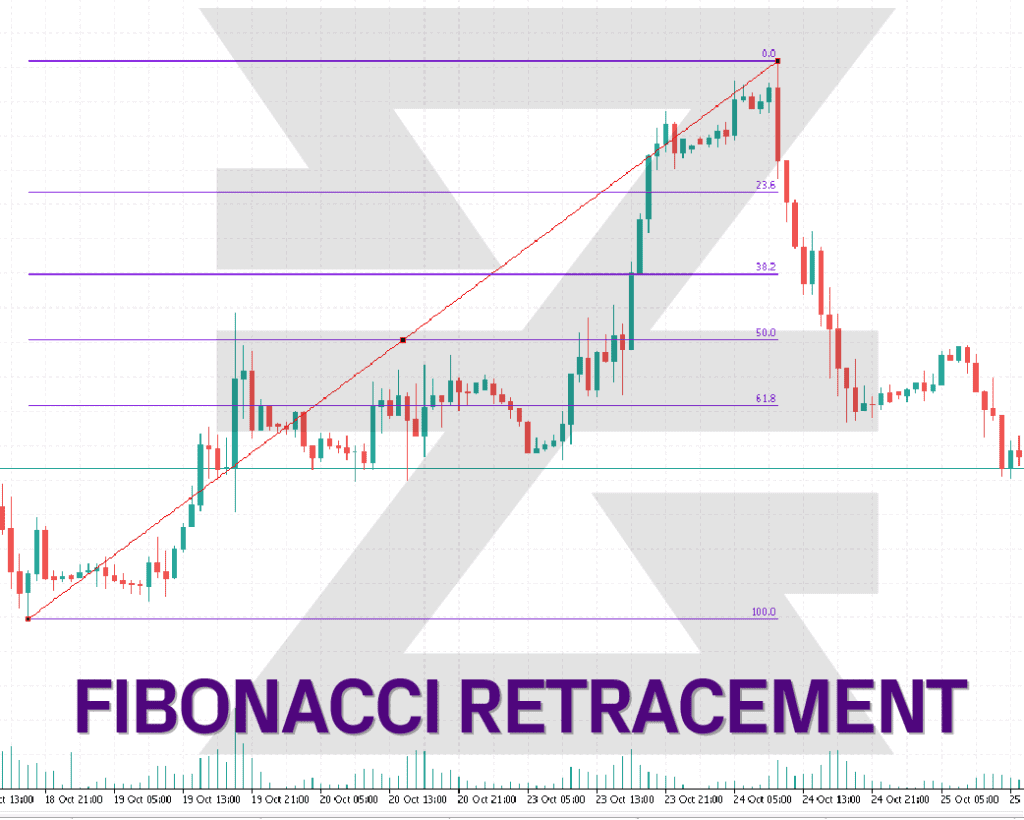
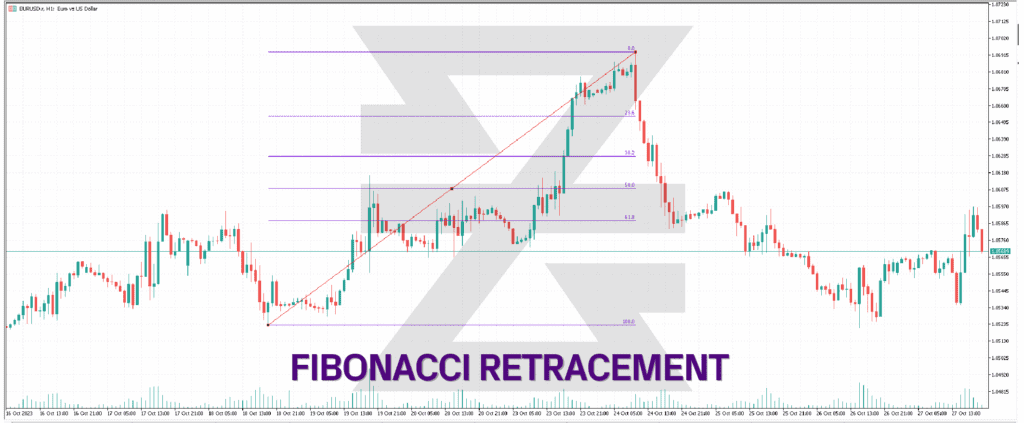
Fibonacci Retracement involves horizontal lines drawn at key percentages where the price is likely to retrace after a significant move.
These percentages often include 23.6%, 38.2%, 50%, 61.8%, and sometimes 78.6% – all based on the Fibonacci sequence’s mathematical properties.
To draw Fibonacci levels:
1. Identify a major peak and trough on the price chart.
2. Draw a vertical line between these two points.
3. Mark the key Fibonacci percentage levels along this line.
For example, if the EUR/USD pair moves from 1.1000 to 1.1500 and then starts to retrace, the 50% retracement level would be 1.1250 (halfway between 1.1000 and 1.1500).


• Support and Resistance:
Fibonacci retracement levels can act as potential support and resistance zones. For instance, if the price retraces to the 38.2% level and then starts to move up, this level could act as support.
• Entry and Exit Points:
Traders might use these levels to identify potential entry or exit points. For example, if one believes a price will retrace before resuming its trend, they might consider entering a trade at a specific Fibonacci level.
• Stop-Loss Placement:
If trading based on a Fibonacci level, a trader might place their stop-loss order just beyond the chosen retracement level, providing a buffer if the price doesn't reverse as anticipated.
• Combination with Other Indicators:
For enhanced accuracy, traders often use Fibonacci retracement levels in conjunction with other technical indicators like moving averages, RSI, or MACD.
• Subjectivity:
Identifying the correct peaks and troughs to draw the Fibonacci levels can be subjective and varies among traders, leading to different retracement levels.
• Prices Not Always Respected:
The price does not always respect Fibonacci levels. At times, it might break through several levels before finding support or resistance.
• Best in Confluence:
The reliability of Fibonacci retracement levels increases when they coincide with other technical indicators or significant historical support/resistance zones.
Leonardo Fibonacci introduced the Fibonacci sequence in his book “Liber Abaci.” While the sequence’s primary purpose was to explain mathematical patterns found in nature, traders have adopted it to predict potential price retracements in financial markets.
Fibonacci Retracement offers traders a framework to forecast potential price reversal points in the Forex CFD market. While the concept revolves around a simple mathematical sequence, its application requires keen observation, experience, and a degree of subjectivity. As always, it’s wise for traders to use Fibonacci retracement in conjunction with other technical analysis tools and maintain a stringent risk management protocol to harness its full potential.
Check out top trading indicators, including Fibonacci Retracement, and how they are used to make profit in this helpful video
→
Want to learn more? Discover more important concepts used in technical analysis for forex trading or view more trading indicators below
Start placing forex trades with a Baxia trading account
Looking for more?
Explore our Education Center
View our collection of free education resources dedicated to help you become a more informed and confident trader.
BAXIA GLOBAL LIMITED
Join the community
Risk Warning: Margin trading involves a high level of risk, and may not be suitable for all investors. You should carefully consider your objectives, financial situation, needs and level of experience before entering into any margined transactions with Baxia Markets, and seek independent advice if necessary. Forex and CFDs are highly leveraged products which mean both gains and losses are magnified. You should only trade in these products if you fully understand the risks involved and can afford losses without adversely affecting your lifestyle (including the risk of losing the entirety of your initial investment). You must assess and consider them carefully before making any decision about using our products or services.
Baxia Global Limited is a company registered in Seychelles with registration number: 8426970-1, and is regulated by the Financial Services Authority of Seychelles with License number: SD104.
Baxia Limited is a company registered in The Bahamas with registration number: 177330 B, and is licensed and regulated by The Securities Commission of The Bahamas (SCB), (SIA-F234).
The information on this website is general in nature and doesn’t take into account your personal objectives, financial circumstances, or needs. It is not targeted at the general public of any specific country and is not intended for distribution to residents in any jurisdiction where that distribution would be unlawful or contravene regulatory requirements. Baxia Markets does not offer its services to residents of certain jurisdictions such as USA, Cuba, Sudan/Republic of Sudan, Syria, Iran, Iraq, South Sudan, Venezuela, Libya, Belarus, Afghanistan, Myanmar, Russia, Crimea, Donetsk, Luhansk, Palestine, Yemen, Zimbabwe and North Korea.