- CFDs & Forex Trading | Regulated Online Trading
- About Us
- Trading
- Platforms
- Resources
- Partners
- Research
Search
×
Flags and Pennants are short-term continuation patterns that signify a brief consolidation before the previous move resumes. Both patterns appear typically after a sharp price movement and are accompanied by significant volume, resembling a flag on a pole or a small symmetrical triangle, respectively.

Flags: They are rectangular shapes formed by two parallel trendlines that slope against the prevailing trend (bullish or bearish). Think of them as brief pauses in a trending market.
Pennants: They resemble small symmetrical triangles where the trendlines converge. Like flags, they represent brief consolidations.
• Flag Pole:
The initial strong price movement is the flagpole. The length of the flagpole can be used to estimate the potential continuation move.


• Flag:
A sloping rectangle opposite to the primary trend, formed by the consolidation. In a bullish flag, the rectangle slopes down; in a bearish flag, it slopes up.
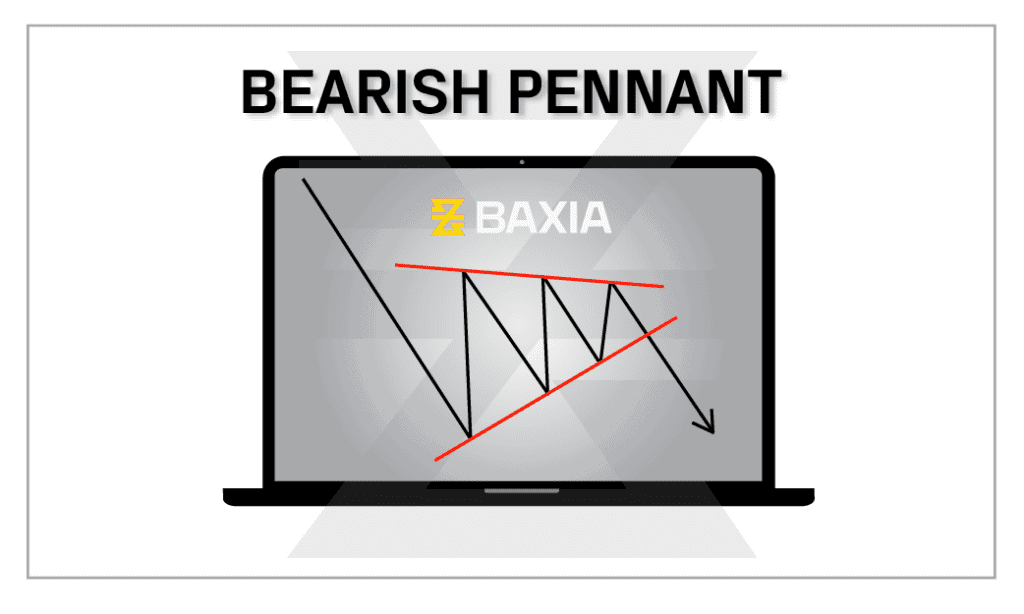

• Pennant:
A small symmetrical triangle that forms after the flagpole. The consolidation period in a pennant is typically shorter than that of a flag.
• How to Find Entry Points:
A breakout in the direction of the prevailing trend from the flag or pennant pattern can serve as a potential entry point. For example, in a bullish flag or pennant, traders might consider buying on a break above the pattern.
• How to Find Price Targets:
The length of the flagpole can give an estimate of the potential continuation move. Project the length from the breakout point of the flag or pennant to set a target.
• When Should Volume Confirmation Occur?
The flagpole's formation should have high volume, while the flag or pennant pattern typically witnesses decreasing volume. An increase in volume on the breakout confirms the pattern.
• What Is the Duration for Flags & Pennant Patterns?
Flags and Pennants are short-term patterns, usually lasting one to four weeks. If they persist longer, reconsider the pattern's validity.
• Slope
A flag's slope should be in the opposite direction of the prevailing trend. If a flag slopes in the same direction as the primary trend, it may signal a weakening trend.
• Stay Aware of False Breakouts:
The pattern might seem to break out only to revert back to its range. It's essential to seek confirmatory signals, possibly waiting for the price to close beyond the boundary of the pattern or utilizing other technical tools.
• Bull Flags vs. Bear Flags:
Bull flags are formed in uptrends and indicate a continuation upwards after the brief pause. Bear flags form in downtrends and suggest a downward continuation.
• Flat Pennants:
While most pennants are symmetrical, some may have a slight horizontal bias. These are still considered valid, given the other criteria are met.
Flags and Pennants have been recognized in technical analysis literature for many decades as reliable continuation patterns. Their relatively short formation time and clear visual cues make them favorites among traders.
Flags and Pennants are potent tools in a trader’s arsenal when navigating the fast-paced world of Forex CFD trading. Their ability to provide timely insights into short-term price consolidations and potential trend continuations makes them invaluable. However, as with all technical patterns, it’s crucial to use them in conjunction with other tools and maintain a disciplined approach to risk management.
Want to learn more? Discover more important concepts used in technical analysis for forex trading below
Start placing forex trades with a Baxia trading account
Looking for more?
Explore our Education Center
View our collection of free education resources dedicated to help you become a more informed and confident trader.
BAXIA LIMITED
BAXIA GLOBAL LIMITED
Join the community
Risk Warning: Margin trading involves a high level of risk, and may not be suitable for all investors. You should carefully consider your objectives, financial situation, needs and level of experience before entering into any margined transactions with Baxia Markets, and seek independent advice if necessary. Forex and CFDs are highly leveraged products which mean both gains and losses are magnified. You should only trade in these products if you fully understand the risks involved and can afford losses without adversely affecting your lifestyle (including the risk of losing the entirety of your initial investment). You must assess and consider them carefully before making any decision about using our products or services.
Baxia Global Limited is a company registered in Seychelles with registration number: 8426970-1, and is regulated by the Financial Services Authority of Seychelles with License number: SD104.
Baxia Limited is a company registered in The Bahamas with registration number: 177330 B, and is licensed and regulated by The Securities Commission of The Bahamas (SCB), (SIA-F234).
The information on this website is general in nature and doesn’t take into account your personal objectives, financial circumstances, or needs. It is not targeted at the general public of any specific country and is not intended for distribution to residents in any jurisdiction where that distribution would be unlawful or contravene regulatory requirements. Baxia Markets does not offer its services to residents of certain jurisdictions such as USA, Cuba, Sudan/Republic of Sudan, Syria, Iran, Iraq, South Sudan, Venezuela, Libya, Belarus, Afghanistan, Myanmar, Russia, Crimea, Donetsk, Luhansk, Palestine, Yemen, Zimbabwe and North Korea.