- CFDs & Forex Trading | Regulated Online Trading
- About Us
- Trading
- Platforms
- Resources
- Partners
- Research
Search
×
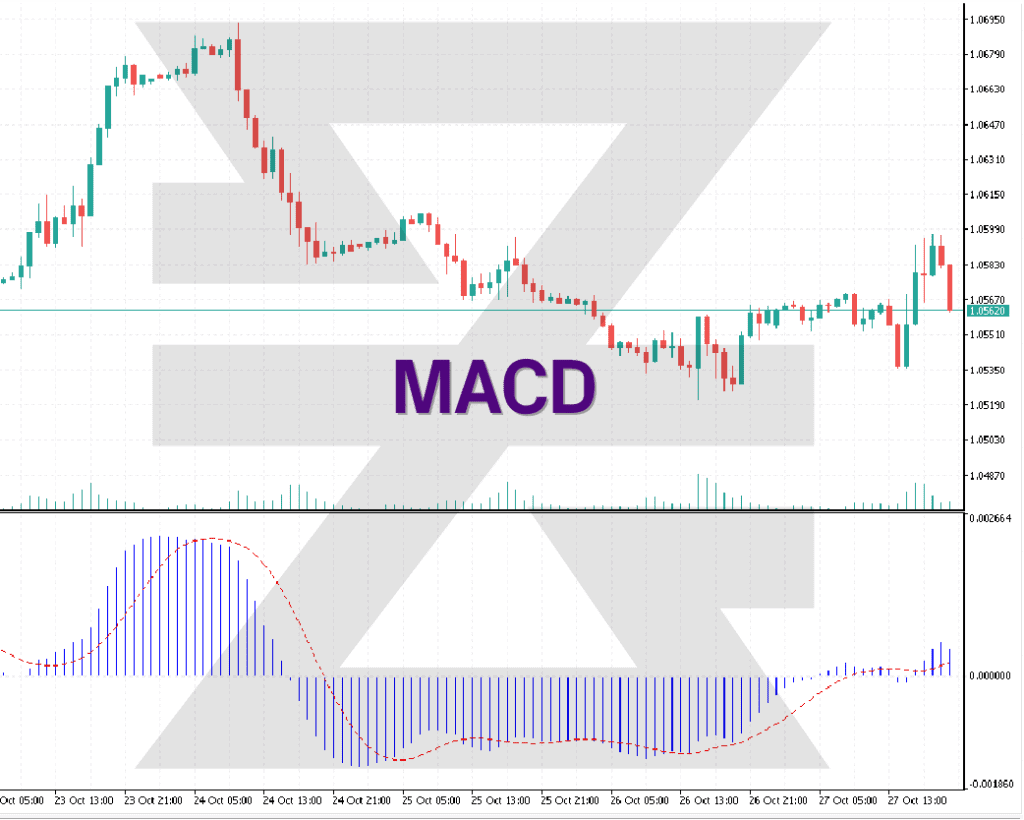
The Moving Average Convergence Divergence (MACD) is a trend-following momentum indicator that reveals the relationship between two moving averages of an asset’s price. It’s particularly useful for spotting shifts in the strength, direction, momentum, and duration of a trend. Here’s a closer look:

MACD consists of the MACD line, the signal line, and the histogram. The MACD line represents the difference between a short-term and a long-term moving average, typically the 12-day and 26-day exponential moving averages (EMAs). The signal line is the 9-day EMA of the MACD line. The histogram illustrates the distance between the MACD line and the signal line.
The MACD is calculated by subtracting the 26-period Exponential Moving Average (EMA) from the 12-period EMA. Additionally, a nine-day EMA of the MACD itself is plotted alongside the MACD value—acting as a signal line to identify turns in the indicator.
Here the are the computational steps:

MACD Line: (12-period EMA) − (26-period EMA)
Signal Line: 9-period EMA of the MACD
MACD Histogram: MACD Line−Signal Line
Traders often look for signal line crossovers (where the MACD crosses above or below the Signal line), centerline crossovers (where the MACD moves above or below zero), and divergences to identify potential buy or sell signals.

• Signal Line Crossovers:
The most common MACD signals derive from crossovers. When the MACD line crosses above the signal line, it can be a bullish sign. Conversely, if the MACD line crosses below the signal line, it might be a bearish signal.
• Histogram:
The MACD histogram can provide a visual representation of the distance between the MACD and its signal line. A growing histogram can signal a strengthening trend, while a shrinking histogram may indicate a weakening trend.
• Divergence:
If the price of an asset is making new highs/lows, but the MACD isn't, it can indicate a potential price reversal. For instance, if an asset price makes a new high but the MACD doesn't, this bearish divergence could suggest a future downturn.
• Overbought/Oversold:
Although not its primary use, the MACD can be interpreted as overbought or oversold. If the MACD moves away from the zero line, it can suggest overextension and potential for a reversal to the mean.
• Lagging Nature:
The MACD is based on moving averages, and thus, it's inherently a lagging indicator. It might not always be the best tool for early signals.
• False Signals:
Particularly in choppy or sideways markets, the MACD can produce false signals, suggesting trends that don't sustain.
• Requires Confirmation:
Due to its potential for false signals, many traders seek confirmation from other indicators or techniques before acting on MACD signals.
Developed by Gerald Appel in the late 1970s, the MACD is now one of the most popular and widely used technical indicators, esteemed for its simplicity and versatility in identifying trends and momentum.
The Moving Average Convergence Divergence (MACD) is a powerful tool in a trader’s arsenal, especially for those seeking to understand trend strength and momentum in Forex CFD trading. However, as with all indicators, it’s vital to use it in conjunction with other tools and to be aware of its limitations. Proper interpretation combined with risk management can enhance its efficacy in a trading strategy.
Check out top trading indicators, including MACD, and how they are used to make profit in this helpful video
→
Want to learn more? Discover more important concepts used in technical analysis for forex trading or view more trading indicators below
Start placing forex trades with a Baxia trading account
Looking for more?
Explore our Education Center
View our collection of free education resources dedicated to help you become a more informed and confident trader.
BAXIA LIMITED
BAXIA GLOBAL LIMITED
Join the community
Risk Warning: Margin trading involves a high level of risk, and may not be suitable for all investors. You should carefully consider your objectives, financial situation, needs and level of experience before entering into any margined transactions with Baxia Markets, and seek independent advice if necessary. Forex and CFDs are highly leveraged products which mean both gains and losses are magnified. You should only trade in these products if you fully understand the risks involved and can afford losses without adversely affecting your lifestyle (including the risk of losing the entirety of your initial investment). You must assess and consider them carefully before making any decision about using our products or services.
Baxia Global Limited is a company registered in Seychelles with registration number: 8426970-1, and is regulated by the Financial Services Authority of Seychelles with License number: SD104.
Baxia Limited is a company registered in The Bahamas with registration number: 177330 B, and is licensed and regulated by The Securities Commission of The Bahamas (SCB), (SIA-F234).
The information on this website is general in nature and doesn’t take into account your personal objectives, financial circumstances, or needs. It is not targeted at the general public of any specific country and is not intended for distribution to residents in any jurisdiction where that distribution would be unlawful or contravene regulatory requirements. Baxia Markets does not offer its services to residents of certain jurisdictions such as USA, Cuba, Sudan/Republic of Sudan, Syria, Iran, Iraq, South Sudan, Venezuela, Libya, Belarus, Afghanistan, Myanmar, Russia, Crimea, Donetsk, Luhansk, Palestine, Yemen, Zimbabwe and North Korea.