- CFDs & Forex Trading | Regulated Online Trading
- About Us
- Trading
- Platforms
- Resources
- Partners
- Research
Search
×
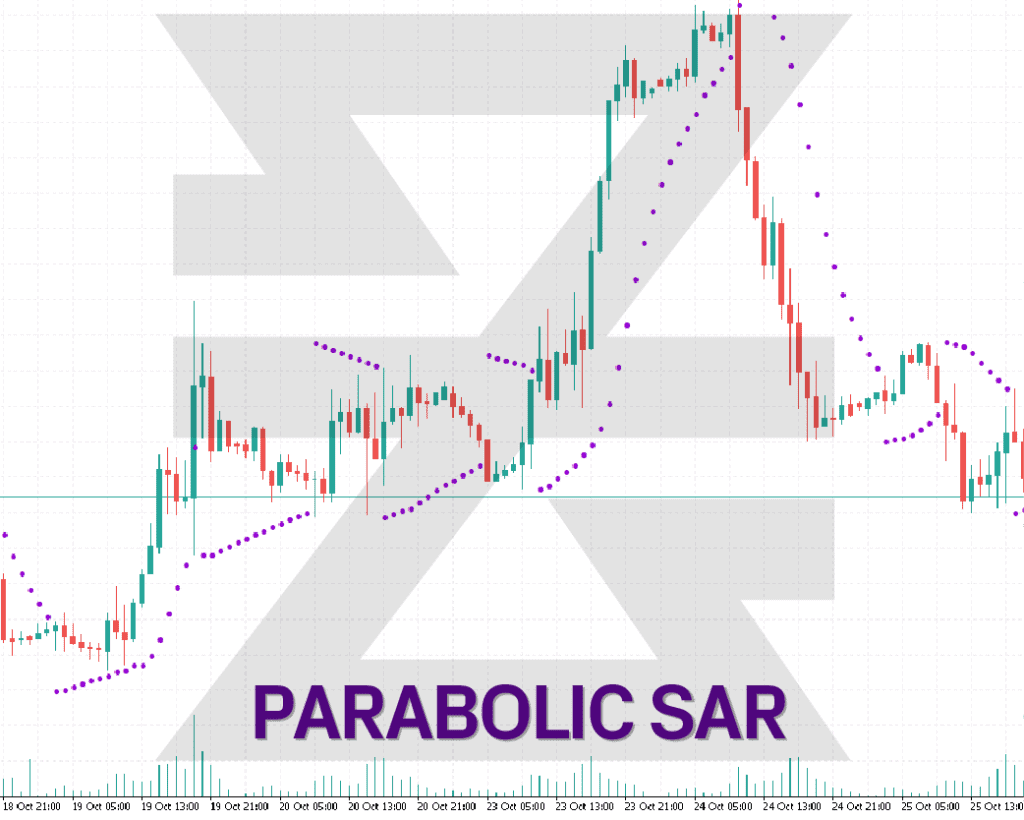
The Parabolic SAR (Stop and Reverse) is a trend-following technical indicator designed to provide entry and exit points, and to determine the direction of an asset’s momentum. Developed by the renowned technical analyst Welles Wilder in 1978, the Parabolic SAR is often depicted as dots placed above or below a price chart, representing the “stop and reverse” points. Here’s an in-depth exploration:
QUICK LINK TO CONTENT

The Parabolic SAR provides traders with potential “stop loss” levels and indicates the trend direction of a financial asset. When the dots are below the price chart, the trend is upward; when above, the trend is downward.
While the Parabolic SAR formula can seem intricate, the primary takeaway is that it factors in the asset’s highest and lowest prices, as well as the acceleration factor, which increases when the price moves in the direction of the SAR.
The parabolic SAR is calculated as:
• Uptrend: PSAR = Prior PSAR + Prior AF (Prior EP - Prior PSAR)
• Downtrend: PSAR = Prior PSAR - Prior AF (Prior PSAR - Prior EP)
Where:
• EP = Highest high for an uptrend and lowest low for a downtrend, updated each time a new EP is reached.
• AF = Default of 0.02, increasing by 0.02 each time a new EP is reached, with a maximum of 0.20.
This calculation produces a dot (which can be linked with a line if preferred) beneath the increasing price movement, or over the declining price movement. These dots emphasize the existing price trajectory. They’re continuously visible, hence the name of the indicator: “stop and reverse.” When the price falls beneath the rising dots, the dots flip on top to sit above the price bars. Conversely, when the price surges past the falling dots, the dots flip below the price bars.
Fortunately, graphing tools manage these arithmetic tasks for us, yet it still remains valuable to grasp the method of these calculations on your own.
• Trend Direction:
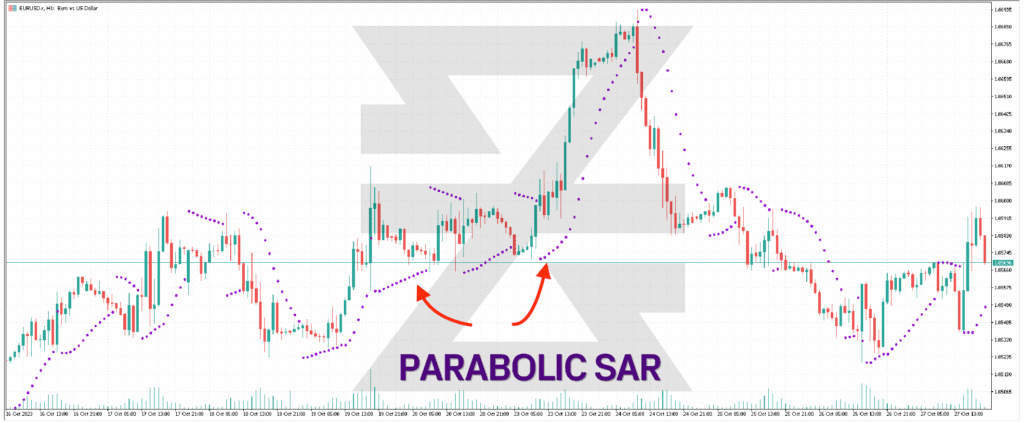
A basic application of the Parabolic SAR is its representation of trends. If the dots are below the price, the trend is bullish, and if they're above the price, the trend is bearish.
• Finding Entry/Exit Points:
When the price crosses the Parabolic SAR dots, it might indicate a potential trend reversal. Thus, a trader might consider entering or exiting a trade based on this crossover.
• Stop-Loss Placement:
The SAR can provide dynamic stop-loss points. In a long trade, a trader might set their stop loss at the SAR value below the price, and in a short trade, above the price.
• Watch for Whipsaws:
In sideways or ranging markets, the Parabolic SAR can produce whipsaws, generating false signals and leading to potential losses.
• Lagging Indicator:
Like many trend-following indicators, the Parabolic SAR can lag, meaning it might not catch the very beginning or end of a trend.
• Acceleration Factor Limitations:
The set increase of the acceleration factor can sometimes result in the SAR moving too quickly, which might not always be ideal for slower-moving markets.
Welles Wilder, the creator of several other renowned technical indicators such as the RSI and ATR, introduced the Parabolic SAR in his 1978 book “New Concepts in Technical Trading Systems.” His idea was to provide a system that could capture the essence of both time and price as a single entity.
The Parabolic SAR offers a visually intuitive and straightforward method for traders to understand market momentum and direction in Forex CFD trading. Its unique ability to provide dynamic entry, exit, and stop-loss levels can be invaluable. However, traders should be wary of its limitations, especially in non-trending markets, and ideally combine it with other tools and strategies for a more holistic trading approach.
Want to learn more? Discover more important concepts used in technical analysis for forex trading or view more trading indicators below
Start placing forex trades with a Baxia trading account
Looking for more?
Explore our Education Center
View our collection of free education resources dedicated to help you become a more informed and confident trader.
BAXIA LIMITED
BAXIA GLOBAL LIMITED
Join the community
Risk Warning: Margin trading involves a high level of risk, and may not be suitable for all investors. You should carefully consider your objectives, financial situation, needs and level of experience before entering into any margined transactions with Baxia Markets, and seek independent advice if necessary. Forex and CFDs are highly leveraged products which mean both gains and losses are magnified. You should only trade in these products if you fully understand the risks involved and can afford losses without adversely affecting your lifestyle (including the risk of losing the entirety of your initial investment). You must assess and consider them carefully before making any decision about using our products or services.
Baxia Global Limited is a company registered in Seychelles with registration number: 8426970-1, and is regulated by the Financial Services Authority of Seychelles with License number: SD104.
Baxia Limited is a company registered in The Bahamas with registration number: 177330 B, and is licensed and regulated by The Securities Commission of The Bahamas (SCB), (SIA-F234).
The information on this website is general in nature and doesn’t take into account your personal objectives, financial circumstances, or needs. It is not targeted at the general public of any specific country and is not intended for distribution to residents in any jurisdiction where that distribution would be unlawful or contravene regulatory requirements. Baxia Markets does not offer its services to residents of certain jurisdictions such as USA, Cuba, Sudan/Republic of Sudan, Syria, Iran, Iraq, South Sudan, Venezuela, Libya, Belarus, Afghanistan, Myanmar, Russia, Crimea, Donetsk, Luhansk, Palestine, Yemen, Zimbabwe and North Korea.