- CFDs & Forex Trading | Regulated Online Trading
- About Us
- Trading
- Platforms
- Resources
- Partners
- Research
Search
×
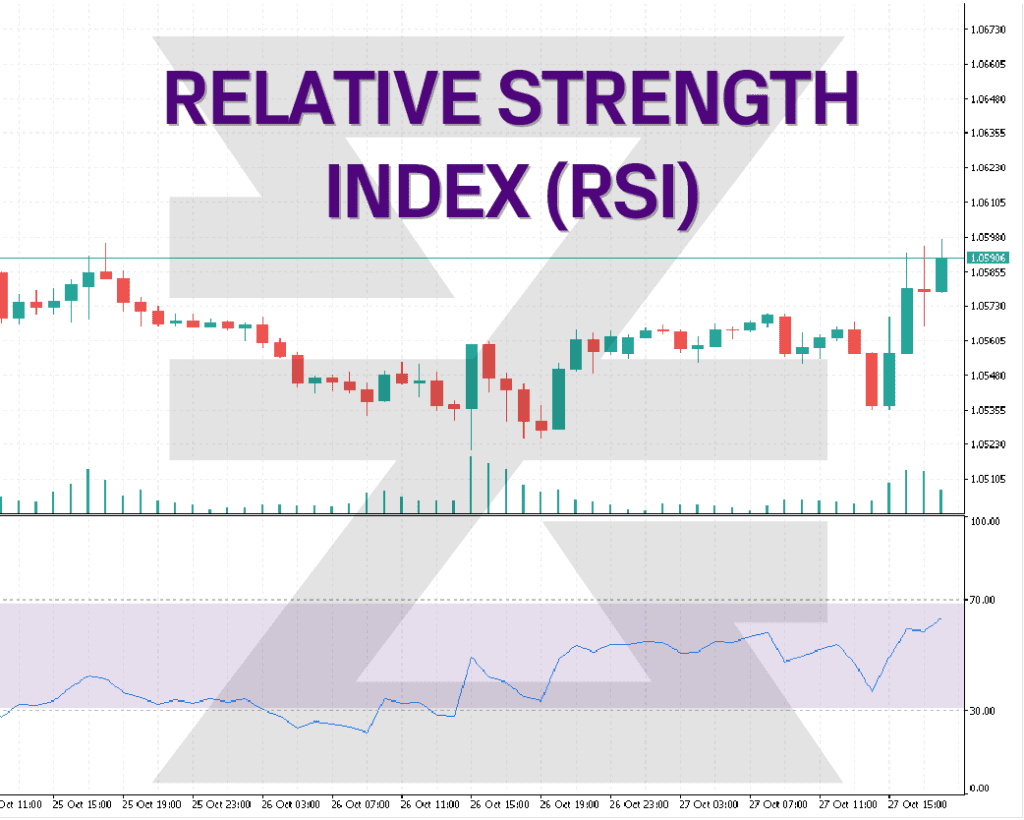
The Relative Strength Index (RSI) is a popular momentum oscillator that measures the speed and change of price movements. It provides insights into overbought or oversold conditions in the market. Let’s dive deeper into its facets.
QUICK LINK TO CONTENT

RSI oscillates between zero and 100 and is typically used to identify overbought or oversold conditions in a traded security. An asset is usually considered overbought when the RSI is above 70 and oversold when it’s below 30.
The RSI is computed using the following steps:
RSI = 100 − [100 / (1 + RS)]
Where:
RS = (Average Loss over n periods) / (Average Gain over n periods)
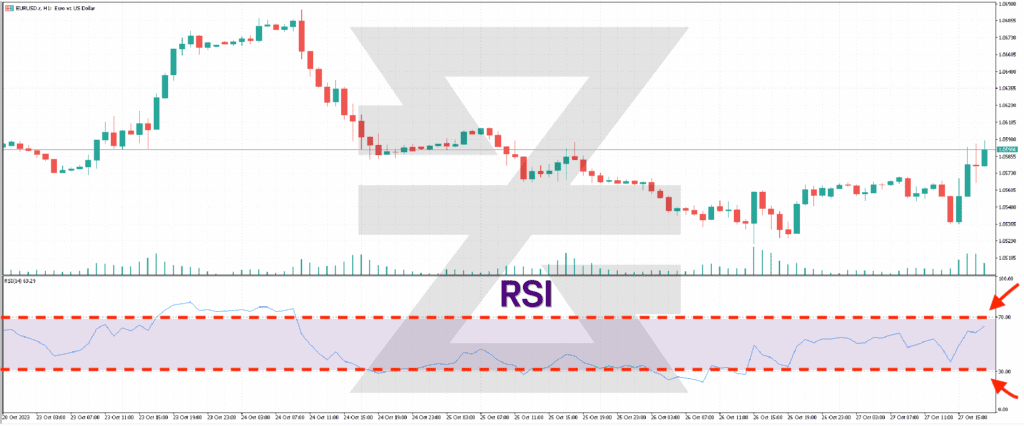
• Overbought/Oversold Identification:
As mentioned, RSI values above 70 indicate overbought conditions, suggesting a potential price reversal to the downside. Conversely, values below 30 indicate oversold conditions, hinting at a possible upward price correction.
• Divergences:
If the price makes a new high or low but the RSI doesn't, it can signal a potential price reversal. For example, if the price makes a new high, but the RSI fails to surpass its previous high, this might indicate weakening momentum and a potential bearish reversal.
• Swing Rejections:
This strategy involves identifying intraday RSI swings that hint at potential reversals. For instance, if in an uptrend the RSI drops below 30 and then rises back above it, it could be a bullish sign.
• Be Mindful of False Signals:
Like other technical indicators, RSI can produce false signals, especially in volatile markets where prices can remain overbought or oversold for extended periods.
• Not a Standalone Indicator:
While RSI provides valuable insights, it's more effective when used in tandem with other technical analysis tools and indicators.
• Adjustment for Different Markets:
The traditional 70/30 thresholds might not always be the best for every market or situation. In strong trending markets, traders might adjust these thresholds to 80/20 to reduce false signals.
Developed by J. Welles Wilder in 1978, the RSI is not just restricted to Forex or CFD trading but is used across various financial instruments, including stocks, commodities, and indices.
The Relative Strength Index is a versatile tool that offers traders insights into market momentum and potential reversals. As with any technical indicator, the key lies in understanding its strengths and weaknesses and combining it with other tools and techniques. In the context of Forex CFD trading, where volatility can be high, ensuring you integrate RSI insights with a robust risk management strategy is imperative.
Check out top trading indicators, including RSI, and how they are used to make profit in this helpful video
→
Want to learn more? Discover more important concepts used in technical analysis for forex trading or view more trading indicators below
Start placing forex trades with a Baxia trading account
Looking for more?
Explore our Education Center
View our collection of free education resources dedicated to help you become a more informed and confident trader.
BAXIA LIMITED
BAXIA GLOBAL LIMITED
Join the community
Risk Warning: Margin trading involves a high level of risk, and may not be suitable for all investors. You should carefully consider your objectives, financial situation, needs and level of experience before entering into any margined transactions with Baxia Markets, and seek independent advice if necessary. Forex and CFDs are highly leveraged products which mean both gains and losses are magnified. You should only trade in these products if you fully understand the risks involved and can afford losses without adversely affecting your lifestyle (including the risk of losing the entirety of your initial investment). You must assess and consider them carefully before making any decision about using our products or services.
Baxia Global Limited is a company registered in Seychelles with registration number: 8426970-1, and is regulated by the Financial Services Authority of Seychelles with License number: SD104.
Baxia Limited is a company registered in The Bahamas with registration number: 177330 B, and is licensed and regulated by The Securities Commission of The Bahamas (SCB), (SIA-F234).
The information on this website is general in nature and doesn’t take into account your personal objectives, financial circumstances, or needs. It is not targeted at the general public of any specific country and is not intended for distribution to residents in any jurisdiction where that distribution would be unlawful or contravene regulatory requirements. Baxia Markets does not offer its services to residents of certain jurisdictions such as USA, Cuba, Sudan/Republic of Sudan, Syria, Iran, Iraq, South Sudan, Venezuela, Libya, Belarus, Afghanistan, Myanmar, Russia, Crimea, Donetsk, Luhansk, Palestine, Yemen, Zimbabwe and North Korea.