- CFDs & Forex Trading | Regulated Online Trading
- About Us
- Trading
- Platforms
- Resources
- Partners
- Research
Search
×
The Simple Moving Average (SMA) is one of the most foundational and widely used technical indicators in the trading arena. Let’s delve deeper into its definition, calculation, applications, and considerations.
QUICK LINK TO CONTENT

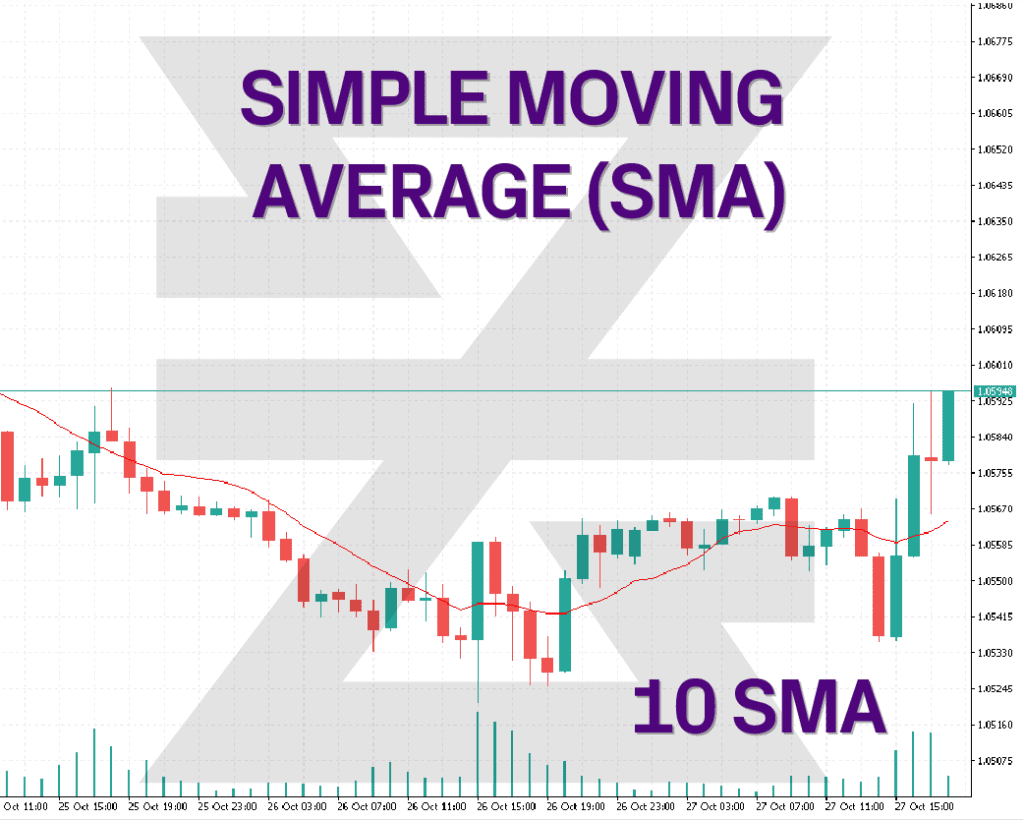
The Simple Moving Average (SMA) is an arithmetic mean of prices over a specified period. It helps smooth out price data to create a single flowing line, which makes it easier to identify the direction of the trend.
To compute the SMA, sum the closing prices of an asset for a specified number of time periods and then divide this total by the number of time periods.
SMA = (Sum of closing prices) / (’n’ periods)
For instance, a 10-day SMA is calculated by adding the closing prices of the last 10 days and dividing by 10.

• Trend Identification:
The direction of the SMA line (ascending or descending) can indicate the prevailing trend. If the SMA is rising, the trend is upward, and vice versa.
• Price Crossovers:
A common trading signal is when the price crosses the SMA. If the price moves above the SMA, it might indicate a bullish signal, and if it drops below, a bearish signal may be inferred.
• Multiple SMA Crossovers:
Traders often use two SMAs – a short-term and a long-term. When the short-term SMA crosses above the long-term SMA, it's seen as a bullish signal, while the opposite crossover is viewed as bearish.
• Support and Resistance:
At times, the SMA can act as a support or resistance level. Prices might bounce off an SMA line before resuming their previous direction.
• Still a Lagging Indicator:
Since SMA relies on past data, it is inherently a lagging indicator. This means it might not respond quickly to sudden price changes, potentially leading to late entry or exit signals.
• Be Careful of False Signals:
In volatile markets, the price can frequently cross the SMA, leading to potential false trading signals.
• Best in Trending Markets:
SMAs work best in strongly trending markets. In sideways or ranging markets, the SMA might produce many false signals.
While the SMA is straightforward, there are other types of moving averages like the Exponential Moving Average (EMA) which gives more weight to recent prices, making it more responsive to current price changes.
The Simple Moving Average is a staple in a trader’s toolkit. While it’s simple to understand and use, it’s crucial to combine it with other technical indicators and analysis methods for a more holistic trading strategy, especially in the nuanced environment of Forex CFD trading. Always be aware of its limitations and ensure risk management principles are firmly in place.
Want to learn more? Discover more important concepts used in technical analysis for forex trading or view more trading indicators below
Start placing forex trades with a Baxia trading account
Looking for more?
Explore our Education Center
View our collection of free education resources dedicated to help you become a more informed and confident trader.
BAXIA LIMITED
BAXIA GLOBAL LIMITED
Join the community
Risk Warning: Margin trading involves a high level of risk, and may not be suitable for all investors. You should carefully consider your objectives, financial situation, needs and level of experience before entering into any margined transactions with Baxia Markets, and seek independent advice if necessary. Forex and CFDs are highly leveraged products which mean both gains and losses are magnified. You should only trade in these products if you fully understand the risks involved and can afford losses without adversely affecting your lifestyle (including the risk of losing the entirety of your initial investment). You must assess and consider them carefully before making any decision about using our products or services.
Baxia Global Limited is a company registered in Seychelles with registration number: 8426970-1, and is regulated by the Financial Services Authority of Seychelles with License number: SD104.
Baxia Limited is a company registered in The Bahamas with registration number: 177330 B, and is licensed and regulated by The Securities Commission of The Bahamas (SCB), (SIA-F234).
The information on this website is general in nature and doesn’t take into account your personal objectives, financial circumstances, or needs. It is not targeted at the general public of any specific country and is not intended for distribution to residents in any jurisdiction where that distribution would be unlawful or contravene regulatory requirements. Baxia Markets does not offer its services to residents of certain jurisdictions such as USA, Cuba, Sudan/Republic of Sudan, Syria, Iran, Iraq, South Sudan, Venezuela, Libya, Belarus, Afghanistan, Myanmar, Russia, Crimea, Donetsk, Luhansk, Palestine, Yemen, Zimbabwe and North Korea.