- CFDs & Forex Trading | Regulated Online Trading
- About Us
- Trading
- Platforms
- Resources
- Partners
- Research
Search
×
Patterns play a pivotal role in technical analysis. They represent the collective psychology of market participants and, when recognized early, can provide significant insights into potential future price movements. Let’s explore some of the most frequently observed patterns in Forex CFD Trading:
QUICK LINK TO CONTENT
• Concept behind This Pattern:
This pattern consists of three peaks. The middle peak (head) is higher than the two outside peaks (shoulders). An inverse H&S pattern is the upside-down version.
• How Are H&S Patterns Used in Trading?
A H&S pattern indicates a potential reversal of an uptrend, while the inverse H&S suggests a potential reversal of a downtrend.

Learn more about Head and Shoulders (H&S) patterns used in technical analysis for forex trading below
• Concept Using This Pattern:
A double top is characterized by two consecutive peaks of nearly the same price, separated by a valley, indicating resistance. The double bottom is its inverse, showing two consecutive valleys, signifying support.
• How Are Double Top & Double Bottom Patterns Used in Trading?
Double tops signal a potential reversal of an uptrend, while double bottoms hint at a reversal of a downtrend.


Learn more about Double Top and Double Bottom patterns in technical analysis for forex trading below
• Concept behind This Pattern:
Triangles are continuation patterns that indicate periods of consolidation before the previous trend resumes. They can be ascending, descending, or symmetrical.
• How Are Triangles Used in Trading?
Ascending triangles, with a flat top and upward sloping bottom, often precede bullish breakouts. Descending triangles, with a flat bottom and downward sloping top, typically lead to bearish breakouts. Symmetrical triangles, where both sides converge, can break either way.

Learn more about Triangle patterns used in technical analysis for forex trading below
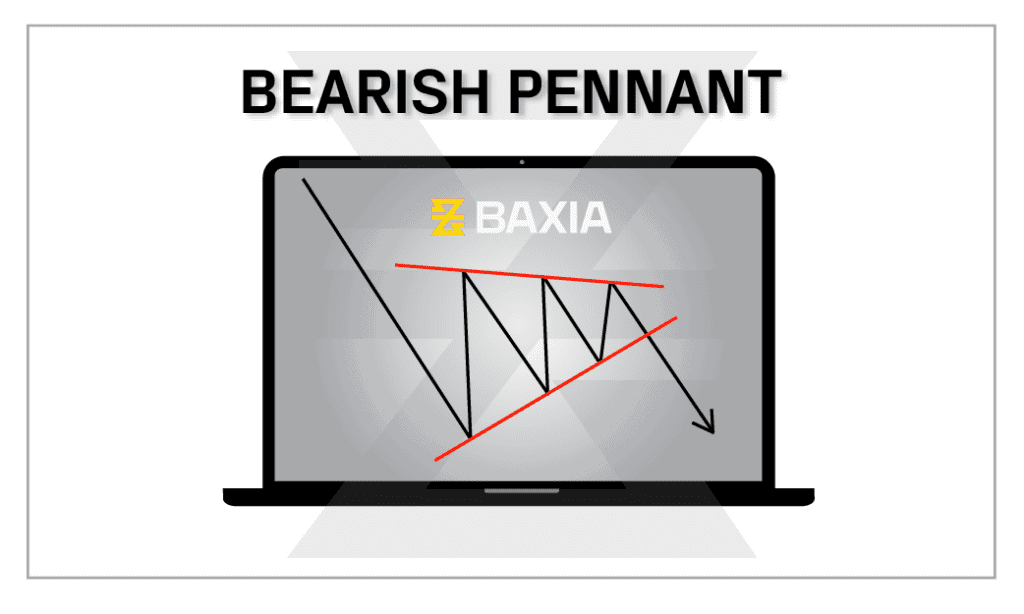
• Concept behind This Pattern:
Both are continuation patterns. Flags are rectangular-shaped and slope against the prevailing trend, while pennants are small symmetrical triangles that form after strong price movements.
• How Are Flags and Pennant Patterns Used in Trading?
After the pattern is completed, the price typically resumes its prior trend. Flags and pennants indicate short consolidations before the main trend continues.

Learn more about Flag and Pennants in technical analysis for forex trading below
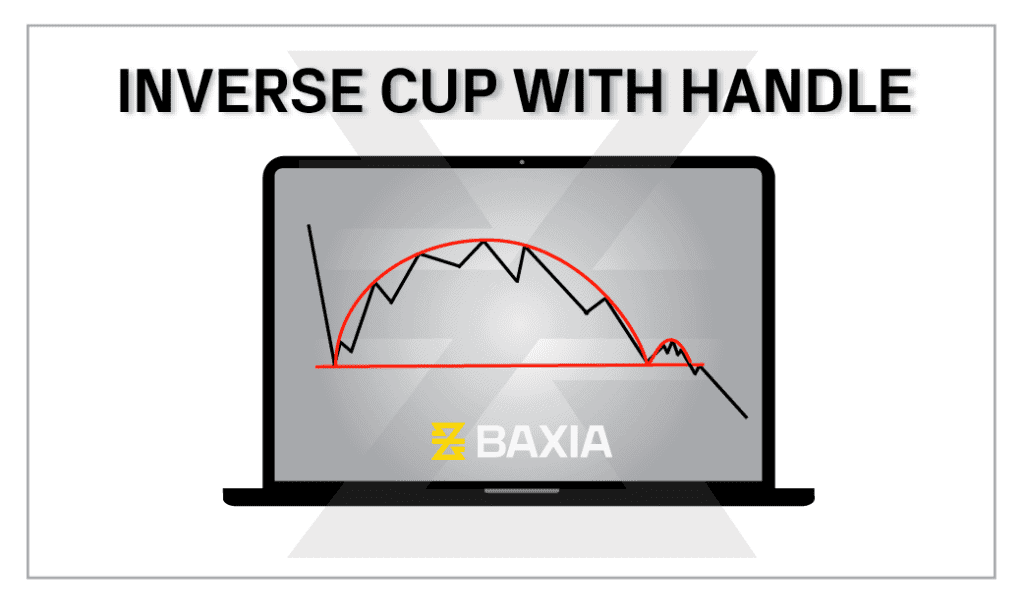
• Concept behind This Pattern:
This pattern resembles the shape of a tea cup. It represents a period of consolidation followed by a breakout.
• How Are Cup and Handle Patterns Used in Trading?
The “cup” formation is followed by a “handle,” which is a short period of consolidation. Once the price breaks above the handle, a bullish continuation is anticipated.

Learn more about Cup and Handle patterns used in technical analysis for forex trading below
• Concept behind This Pattern:
Wedges resemble triangles, but both trendlines are moving in the same direction, either up or down.
• How Are Wedge Patterns Used in Trading?
Rising wedges typically signal bearish reversals, while falling wedges often indicate bullish reversals.


Learn more about Wedge patterns in technical analysis for forex trading below
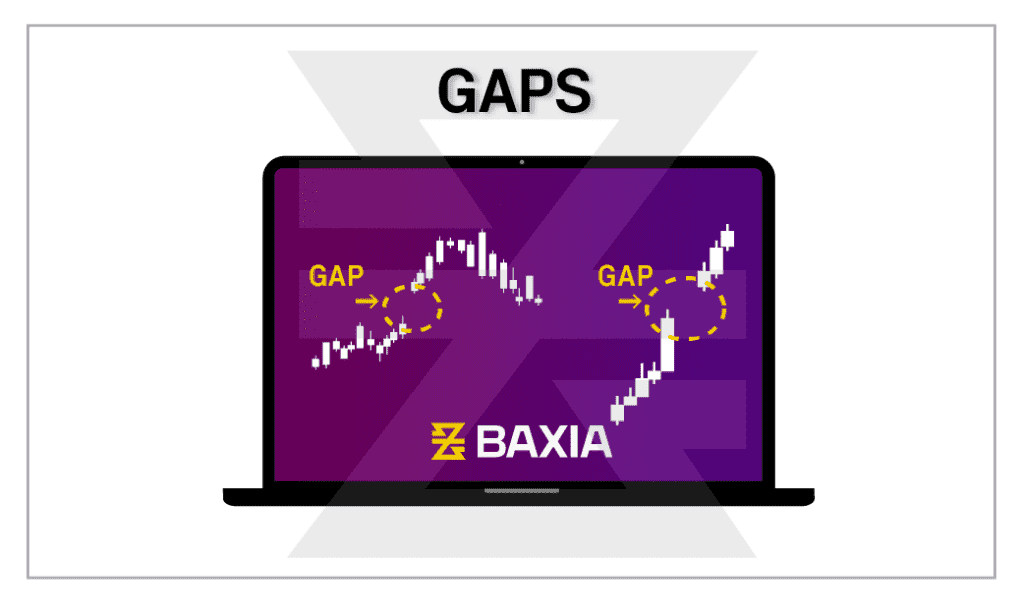
• Concept behind This Pattern:
Gaps are spaces on a chart where no trading activity has taken place, resulting in a break between two price levels.
• How Are Gap Patterns Used in Trading?
Gaps can indicate strong sentiment about an asset. Common types include “Breakaway” (beginning of a trend), “Continuation” (middle of a trend), and “Exhaustion” (end of a trend).
Learn more about Gap patterns used in technical analysis for forex trading below
Patterns in technical analysis offer traders a visual framework to anticipate potential price movements. While these patterns have historically shown reliability, no pattern guarantees a certain outcome. As always, effective trading requires a combination of tools, proper risk management, and an understanding of the broader market context in which these patterns form.
Want to learn more? Discover more important concepts used in technical analysis for forex trading below
Start placing forex trades with a Baxia trading account
Looking for more?
Explore our Education Center
View our collection of free education resources dedicated to help you become a more informed and confident trader.
BAXIA LIMITED
BAXIA GLOBAL LIMITED
Join the community
Risk Warning: Margin trading involves a high level of risk, and may not be suitable for all investors. You should carefully consider your objectives, financial situation, needs and level of experience before entering into any margined transactions with Baxia Markets, and seek independent advice if necessary. Forex and CFDs are highly leveraged products which mean both gains and losses are magnified. You should only trade in these products if you fully understand the risks involved and can afford losses without adversely affecting your lifestyle (including the risk of losing the entirety of your initial investment). You must assess and consider them carefully before making any decision about using our products or services.
Baxia Global Limited is a company registered in Seychelles with registration number: 8426970-1, and is regulated by the Financial Services Authority of Seychelles with License number: SD104.
Baxia Limited is a company registered in The Bahamas with registration number: 177330 B, and is licensed and regulated by The Securities Commission of The Bahamas (SCB), (SIA-F234).
The information on this website is general in nature and doesn’t take into account your personal objectives, financial circumstances, or needs. It is not targeted at the general public of any specific country and is not intended for distribution to residents in any jurisdiction where that distribution would be unlawful or contravene regulatory requirements. Baxia Markets does not offer its services to residents of certain jurisdictions such as USA, Cuba, Sudan/Republic of Sudan, Syria, Iran, Iraq, South Sudan, Venezuela, Libya, Belarus, Afghanistan, Myanmar, Russia, Crimea, Donetsk, Luhansk, Palestine, Yemen, Zimbabwe and North Korea.