- CFDs & Forex Trading | Regulated Online Trading
- About Us
- Trading
- Platforms
- Resources
- Partners
- Research
Search
×
The head and shoulders pattern is a highly reliable technical indicator that forecasts a reversal from bullish to bearish market conditions. This formation reflects a benchmark with three high points, the middle point being the highest and the outer two highs being relatively close in height.
Head and shoulders patterns are widely recognized by technical analysts and are considered to be excellent tools that can be used by traders to make well-informed decisions and maximize profits.
Traders and investors of all skill levels can benefit from the pattern’s versatility. The formation’s entry, stop, and price target levels are all clearly marked, making it simple to employ. Continue reading below to learn more.
SHARE THIS ARTICLE:
Stock prices are the outcome of constant back-and-forth trading between bulls and bears. “Bulls” predict that stock or asset prices will rise, while “bears” believe that stock or asset prices will decline.
If the bulls are winning, then the price of the stock will go up as new investors buy-in to take advantage of the opportunity.
If the bears are winning, then the price will go down as existing shareholders sell their shares to avoid losing money.
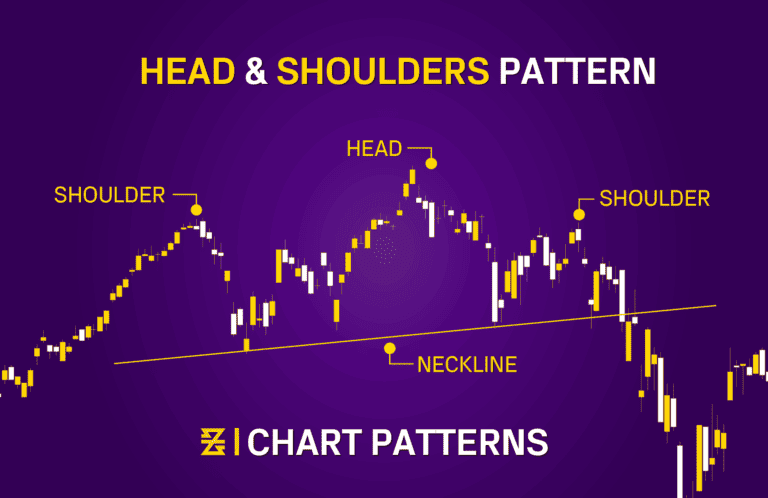
A head and shoulders pattern consists of three components:
Considering the above-mentioned components, the first and third peaks form the shoulders, while the second peak makes up the head.
The neckline is the line that connects the first and second troughs.
The inverse head and shoulders pattern signal that the market is transitioning from a downward trend into an upward trend—good news if you are an investor.
This pattern is formed when the market reverses direction and forms an upside-down head and shoulders pattern, signaling a change in the trend from bearish to bullish.
The inverse head and shoulders pattern is a great way to spot when asset prices are about to dip.
This pattern happens when prices dip into three lows, with the middle one being the lowest.
The shoulders are less deep than the head, and once the second shoulder has formed, prices will make a final rally.
This rally indicates that the market is now under the grip of bulls and that the declining trend has inverted.
The head and shoulders pattern is commonly used by traders to calculate price target estimates and place stop-loss orders.
This pattern is favored for its simplicity and accuracy. When there’s a peaking head and shoulders pattern, the most common practice is positioning stops above the highest price point of the head.
In contrast, with an inverse head and shoulders pattern, the stops are usually positioned below the lowest price created by the head pattern.
To figure out how much prices will shift after the neckline is broken, you must go back to the pattern and calculate the length from the highest point of its head to the neckline.
Then, just minus the same length from the neckline in the reverse direction, beginning at a point where prices first crossed the neckline after the second shoulder formed.
In other words, assuming that the neckline represents $50 in an asset value when the neck is broken, experts would predict that an asset will probably drop $50 below the neckline price point.
Although this is only an estimation, many traders rely on it and proceed with the idea that prices will fall by at least that amount.
When analyzing a head and shoulders pattern, you can estimate the potential spread amount by measuring the vertical length from the top of the head to the neckline.
For an inverse pattern, you would measure the vertical length from the top of the head to the neckline to estimate how far prices are likely to move beyond the neckline.
It’s critical to wait for a head and shoulders pattern to fully develop before making any trades. And so, you shouldn’t execute trades according to what you think will happen if the pattern seems to have developed, or is in the process of developing.
Watch patterns as they emerge and be patient since the market may shift in the blink of an eye.
Make sure you don’t get sucked into the trap of expecting too much.
You should also prepare your trades ahead of time so that you are ready to go when the neckline has been broken.
Keep an eye out for factors that might force you to alter your entry, stop loss, or take profit in any way.
Traders often choose an alternative entry point. However, it takes effort, patience, and prompt action at the appropriate moment.
Traders that use this technique observe the pattern and, after the neckline is broken, wait for prices to recover upward to, or somewhat over, the neckline level. This is a much more cautious trade that frequently enables a trader to join at a lower price.
However, there’s a chance you’ll be awaiting a pullback that never materializes and therefore lose out on the trading opportunity entirely.
Looking to get into trading? Baxia Markets is the perfect solutions provider, offering flexible instruments and plenty of features to help you get started with forex, metals, energy, cryptocurrency, and indices.
With low spreads and access to free education and trading resources, Baxia Markets is the perfect choice for anyone looking to get into the world of trading. You can read why other traders choose Baxia Markets here.
If you’re interested in CFD trading, Baxia is the perfect place to start. Click here to register for a risk-free demo today.
Start placing forex trades with a Baxia trading account
Related Articles
Looking for more?
Explore our Education Center
View our collection of free education resources dedicated to help you become a more informed and confident trader.
BAXIA LIMITED
BAXIA GLOBAL LIMITED
Join the community
Risk Warning: Margin trading involves a high level of risk, and may not be suitable for all investors. You should carefully consider your objectives, financial situation, needs and level of experience before entering into any margined transactions with Baxia Markets, and seek independent advice if necessary. Forex and CFDs are highly leveraged products which mean both gains and losses are magnified. You should only trade in these products if you fully understand the risks involved and can afford losses without adversely affecting your lifestyle (including the risk of losing the entirety of your initial investment). You must assess and consider them carefully before making any decision about using our products or services.
Baxia Global Limited is a company registered in Seychelles with registration number: 8426970-1, and is regulated by the Financial Services Authority of Seychelles with License number: SD104.
Baxia Limited is a company registered in The Bahamas with registration number: 177330 B, and is licensed and regulated by The Securities Commission of The Bahamas (SCB), (SIA-F234).
The information on this website is general in nature and doesn’t take into account your personal objectives, financial circumstances, or needs. It is not targeted at the general public of any specific country and is not intended for distribution to residents in any jurisdiction where that distribution would be unlawful or contravene regulatory requirements. Baxia Markets does not offer its services to residents of certain jurisdictions such as USA, Cuba, Sudan/Republic of Sudan, Syria, Iran, Iraq, South Sudan, Venezuela, Libya, Belarus, Afghanistan, Myanmar, Russia, Crimea, Donetsk, Luhansk, Palestine, Yemen, Zimbabwe and North Korea.